Bitcoin halving is about 11 days on, there are many opinions about its impact
Ahead of the Bitcoin halving, it is natural that many media are talking about this important event for the Bitcoin community. Various opinions and strategies have been prepared by traders to face all possibilities after the halving.
On the other hand, Bitcoin in the last 30 days has only moved around 4%, in contrast to before March, bullish sentiment dominated the market. Even the increase in Bitcoin value exceeds the volatility of gold prices. However, recently the opposite has happened, the gold price trend tends to increase while Bitcoin actually fell 18% this April.
According to our Coinbase Bitcoin halving is actually a challenge in itself because crypto volume is slowing down. The crypto market needs another narrative that can boost prices.
“The BTC halving, currently due April 20 or 21, could be a catalyst for higher prices, but it will have to contend with what is typically a weak time of year for crypto markets and other risk assets,” the exchange stated.
“As a result, we think dips will likely see more aggressive buying compared to previous cycles, even as volatility remains during price discovery,” Coinbase wrote.
Halving events are often associated with price spikes as the previous halving in May 2020 saw Bitcoin prices soar to nearly $69,000 in November 2021.
Bitcoin/USD technical analysis today
Bitcoin price today was $69,317.27 at the time of writing down 0.04% on Coinmarketcap. The price range in the last 24 hours was Low at $68,842.36 and High at $70,284.43. The Fear and Greed Index which reflects market interest in crypto assets shows a value of 75, the market is Greed towards crypto assets.
The technical summary of indicators and several moving averages by Investing in the hourly period show a Buy signal at the time of writing. With technical indicators, the signal is neutral and the moving average is a strong buy signal.
On Ticktrader the price is now moving slightly above the middle band line on the daily timeframe. Meanwhile, there is a long wick seen on the Monthly timeframe.
On the daily timeframe, Bollinger bands form a flat channel with a swing high at roughly $73k level prices and a swing low at roughly $62k level prices.
The MA 50 formed an upward channel below the price slightly above the lower band line indicating bullish sentiment in the past 50 days.
The RSI indicator shows level 54, meaning the price is above the uptrend level.
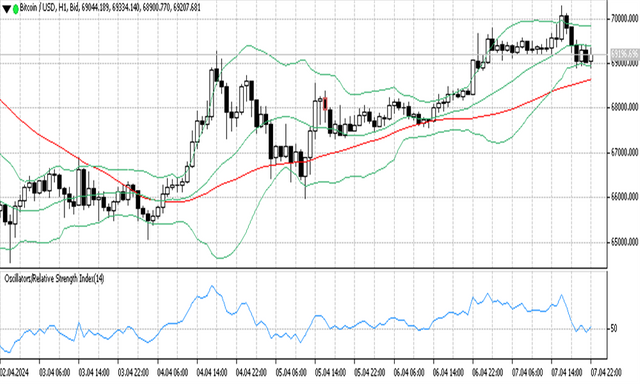
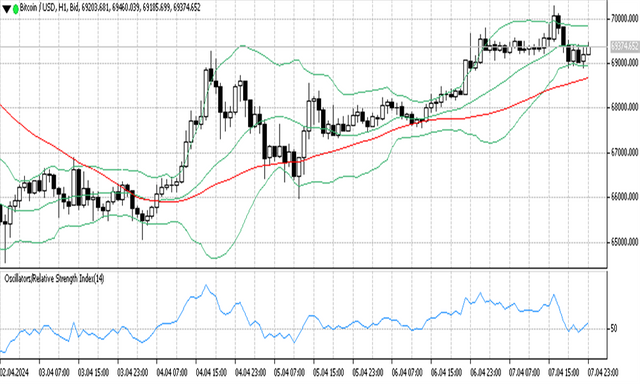
On the H1 timeframe, the bitcoin price moves near the middle band line. Here it appears that the Bollinger band is narrowing, reflecting a market with less volatility.
The MA 50 below the price forms a slight upward channel indicating a slow uptrend market.
The RSI indicator points to level 53, meaning the price is moving above the uptrend level.
Support and resistance
S3: 68537.2
S2: 68726.1
S1: 68961.7
PP: 69150.6
R1: 69386.2
R2: 69575.1
R3: 69810.7


