Charting The Top 10 - Episode #8 - Double Dip
Double Dip
The dip on Sunday was a short one as expected, but another dip which began last night (my time at least) has given the top 10 another pullback.
The charts remain pretty mixed, but there are still some positives to be found. (Depdending on the coin of course).
We also have a switch at the #10 spot with Dash taking the place of IOTA.
This is probably the longest episode of this I've done so far, because in today's episode; I'm going be looking at both the 4 hour charts and the daily charts to try and put together the full picture.
Let's see what we can spot...
Bitcoin
https://www.tradingview.com/x/RIW7Ehia/
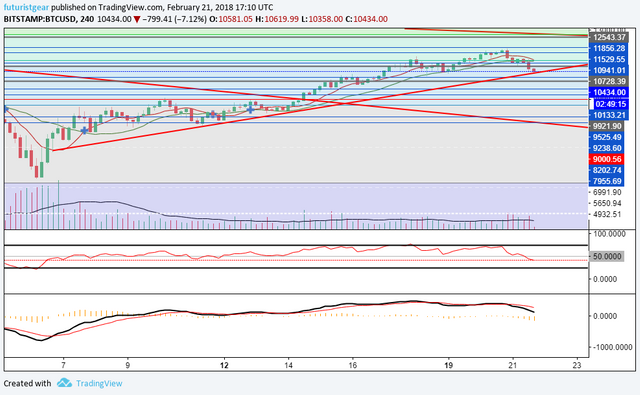
4 Hour Chart
https://www.tradingview.com/x/vxXV8ejm/
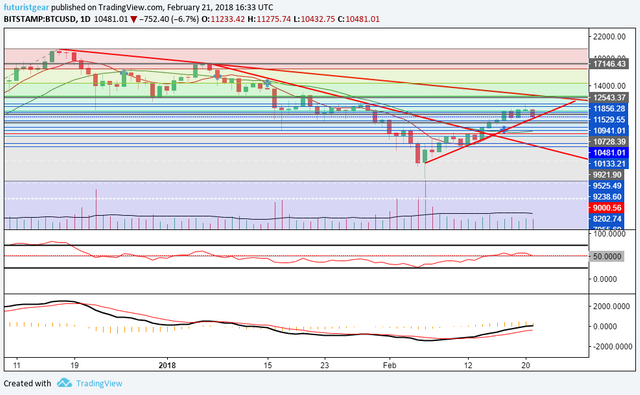
Daily Chart
On the 4 hour chart for BTC, we can see that the short term uptrend line remains intact, but the RSI and MACD are clearly on the bearish side.
Those 2 things aside there is one positive: The MA cross hasn't given a sell signal (at least not yet perhaps).
The daily chart however is still showing fair strength on the RSI, as it remains at around the 50 level, and the MACD is also still on the bullish side too.
The 2 charts combined makes me believe that the current dip is only a short term one, and we should hopefully see some more upside soon.
If not, look for the $10,100 and $9900-ish levels for further support below the trendline.
Ethereum
https://www.tradingview.com/x/7vBjNkFZ/
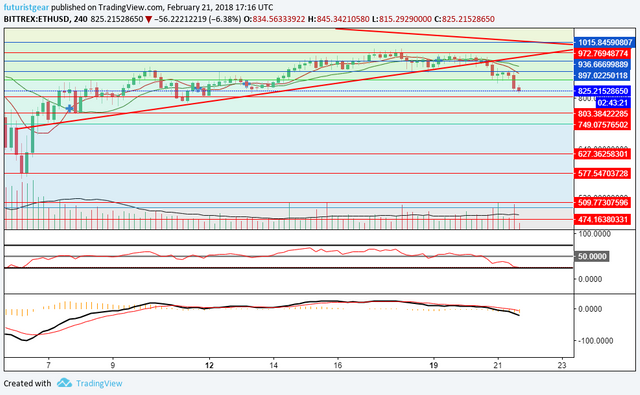
4 Hour Chart
https://www.tradingview.com/x/hIrKVef8/
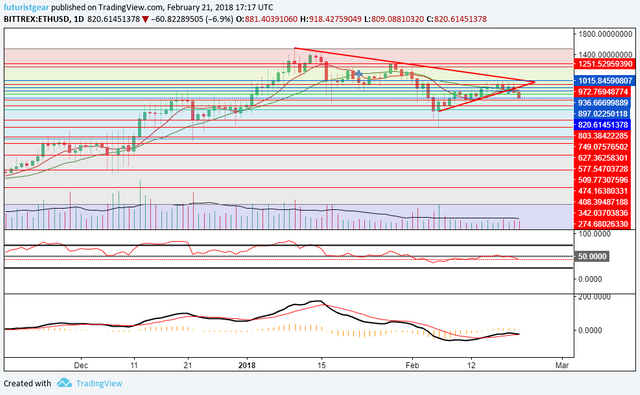
Daily Chart
Ethereum currently looks bearish on the short and longer term time frames. But the 4 hour chart is getting oversold on the RSI which could cause a bounce in the near term.
The uptrend line has been broken in the ETH/USD pairing, and the $800 level is the next major support, with $750 also providing more should it continue to drop.
Ripple
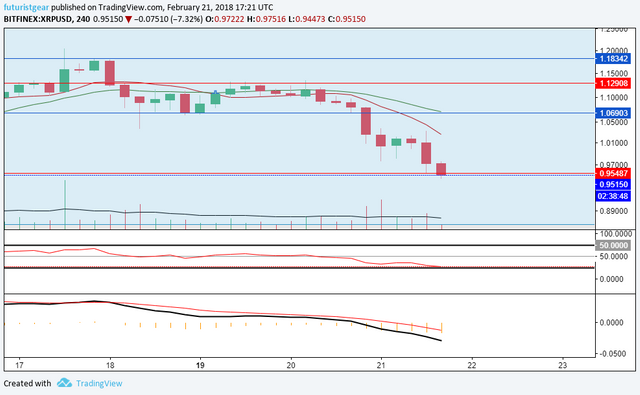
https://www.tradingview.com/x/K2aTwiLc/
4 Hour - Zoomed In
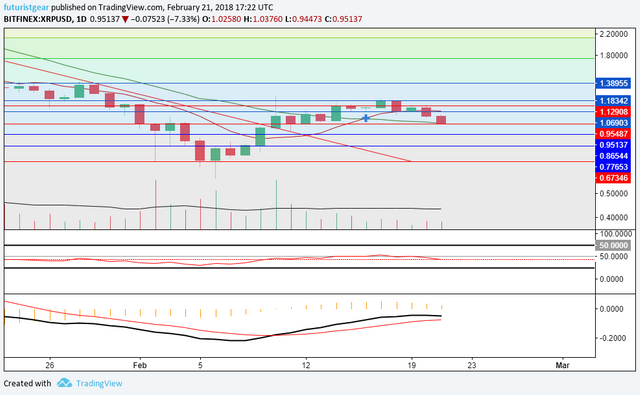
https://www.tradingview.com/x/MT9DhlcR/
Daily Chart
Ripple is also nearing oversold on the 4 hour chart, so a bounce may be coming soon. The MACD also bearish on this time frame here too.
XRP has also lost some of its strength on the daily chart, but the MACD remains in favor of the bulls at the moment.
The key $0.95 level is currently holding as I type, but if it is too drop further Support can be found at $0.86 and also $0.78.
Bitcoin Cash
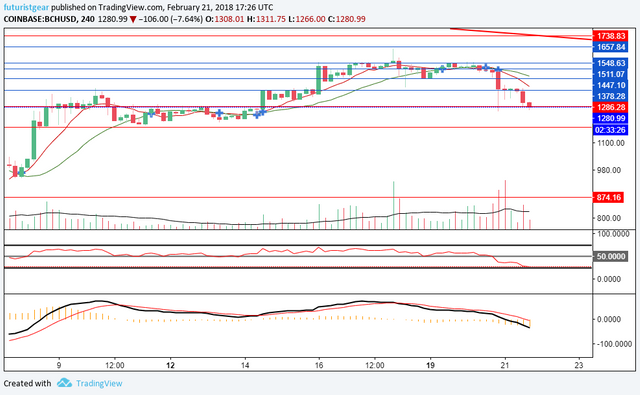
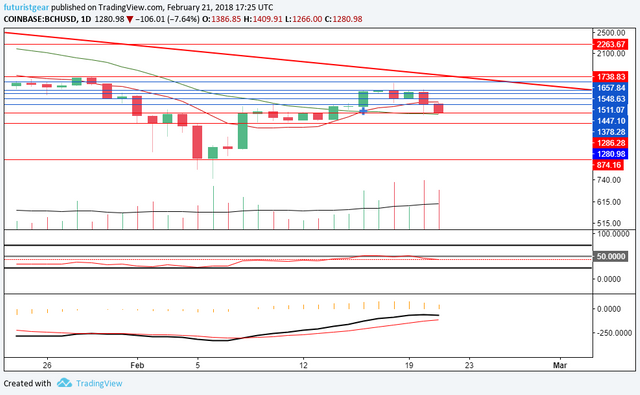
https://www.tradingview.com/x/oCXIWKq2/
Daily Chart
BCH is looking very similar to XRP, but its key support sits at about $1250 currently. It also looks on the verge of going oversold short term, so a bounce may be on the cards here too.
Longer-term, the MACD is still bullish so a recovery could be coming if it can regain some of its strength. If not? The next major support is at about $1180 with no real support beyond that number until about $950.
Litecoin
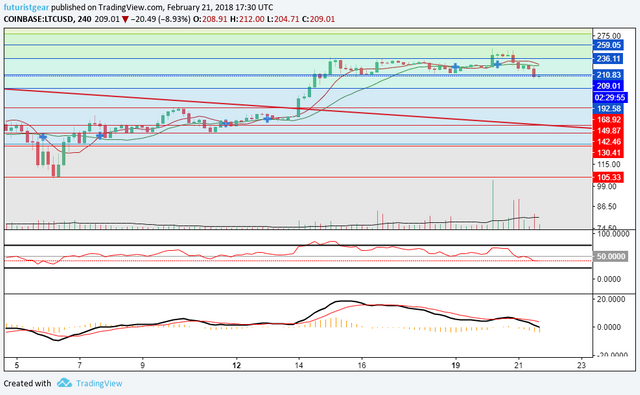
https://www.tradingview.com/x/N5wlk4EP/
4 Hour Chart
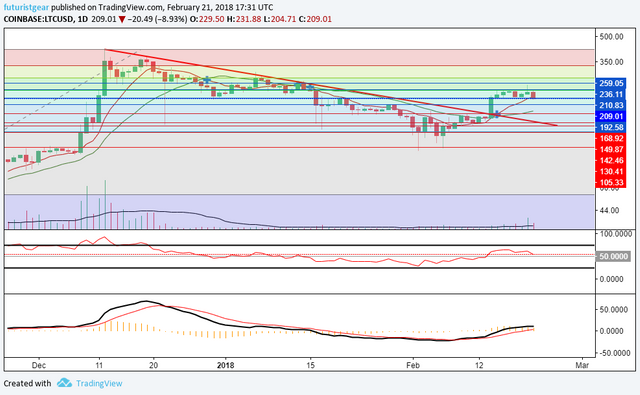
https://www.tradingview.com/x/XroglY1n/
Daily Chart
The RSI and MACD are bearish on the 4 hour chart, so the dip isn't too surprising. But the daily picture remains positive with the RSI holding above the 50 level, and the MACD remaining in favor of the bulls.
There is a support/resistance area in the $205-$210 area that Litecoin is flirting with currently, and more support is at $192 should it dip any further. If the bulls can maintain long term control; the $260 level will need to be tested.
Cardano
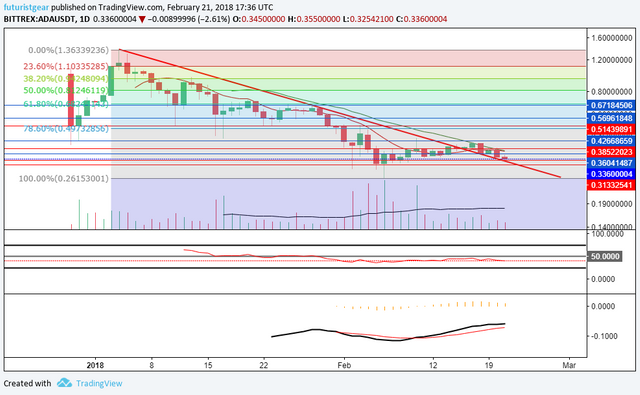
https://www.tradingview.com/x/9wKo3cLx/
Daily Chart
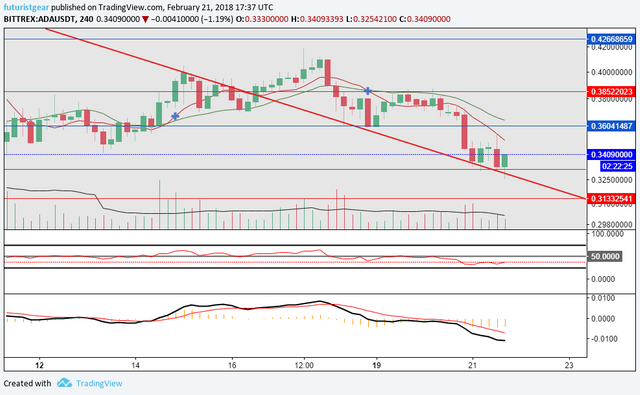
https://www.tradingview.com/x/WwbygGc3/
4 Hour Chart
ADA remains bearish on both time frames, but there are 2 positive signs:
- The daily MACD is on the bullish side, although below the 0 line,
- The downtrend line has been acting as support,
- The $0.33 support level hasn't been broken
That might not be a whole lot of positive signs, but it could be enough of a platform for the bulls regain control of the ADA/USD market some point soon. If not? Look for the next support level at 31c to hold it up.
Stellar
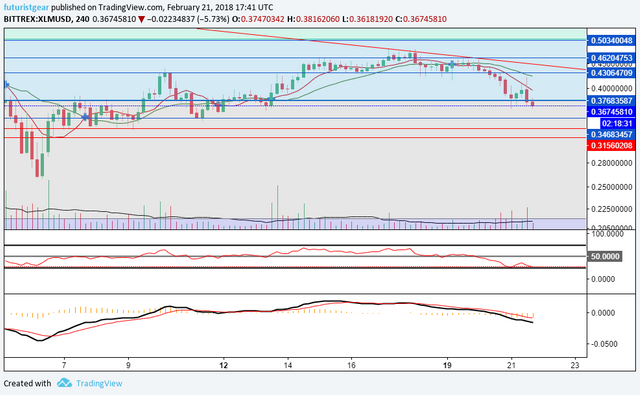
https://www.tradingview.com/x/nvY1m28c/
4 Hour Chart
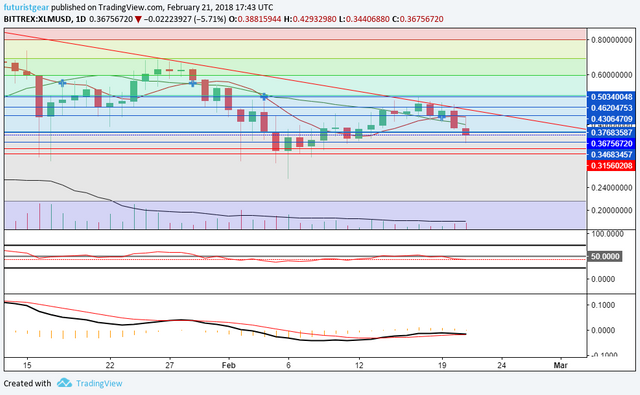
https://www.tradingview.com/x/q92cRSc5/
Daily Chart
Stellar is the weakest looking from the top 10 so far, with indicators looking bearish on both time frames. The only indicator that looks bullish at the moment is the MACD on the Daily chart, and even that looks to be turning back in favor of the bears.
The 35c support is currently holding, and we could get an oversold bounce on the shorter term. If the overall bearish picture remains bearish though, then more support is found at 33c and 31c levels,
NEO
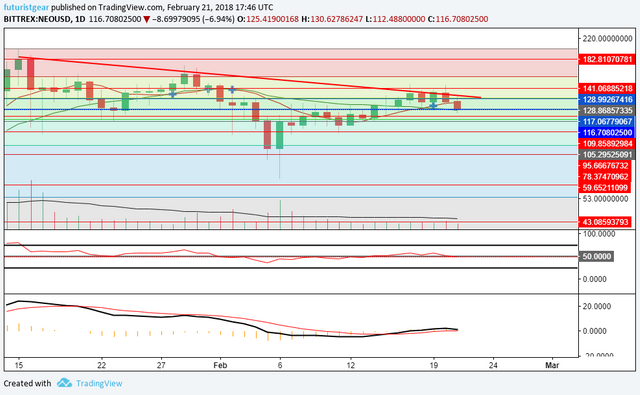
https://www.tradingview.com/x/S9d6n4zO/
Daily Chart
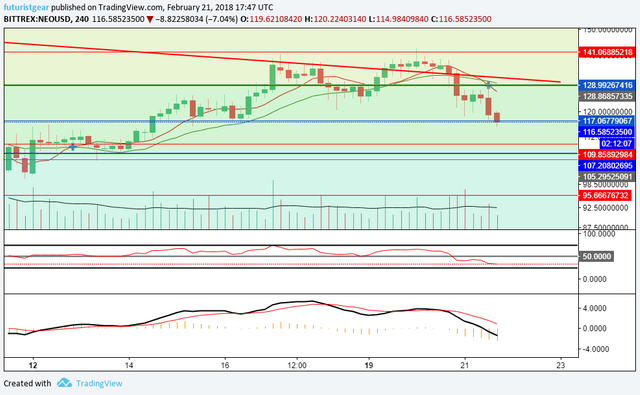
https://www.tradingview.com/x/9CfEydV1/
4 Hour Chart
NEO looks extremely neutral on the daily chart, but the 4 hour chart is showing itself to be bearish, with NEO losing its short term strength, and the MACD switching in the bears favor.
NEO looked like it might have just sneaked out beyond its downtrend line, but sadly it now finds itself back under it.
NEO is a tough one to say which general direction it could be heading in, but since the current support level at about $116 is being tested, and the indicators remain bearish, a short term test of the $110 level could very well be on the cards.
Longer term? The neutral picture suggests some more sideways action to be the direction of travel.
EOS
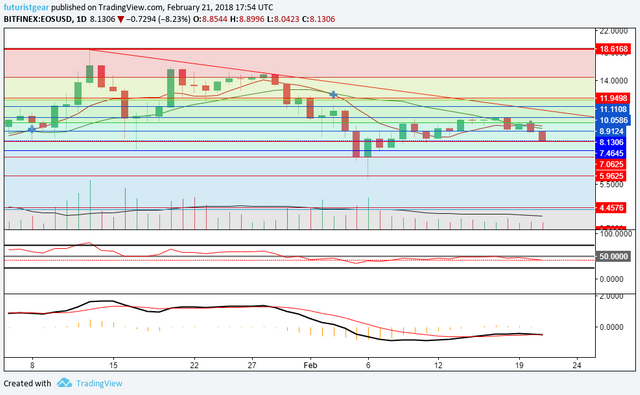
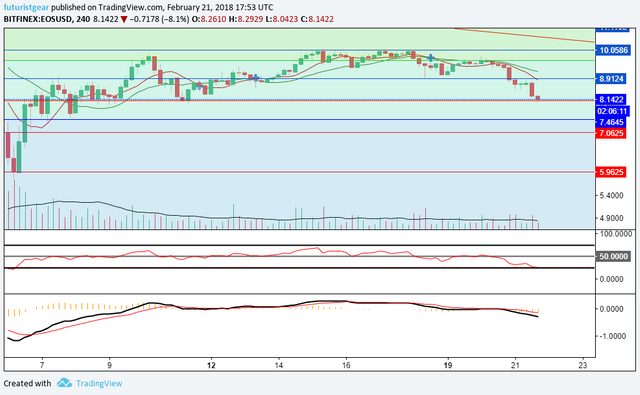
https://www.tradingview.com/x/4fzhJ4M4/
4 Hour Chart
EOS = Part XLM, Part NEO.
EOS is another coin that is yet to break its downtrend line, and the daily chart looks eerily similar to that of NEO.
The somewhat odd thing is, from a short term perspective on the 4 hour chart, it looks more like XLM in nature, with a possible oversold bounce on the cards in the near term.
The $8 support level is holding for EOS, which is a positive sign but the longer term indicators remain bearish so a further drop or more sideways action could be on the cards.
If the $8 levels fails, the next key support is found at $7, resistance is ahead at $10 and also the downtrend line.
Dash
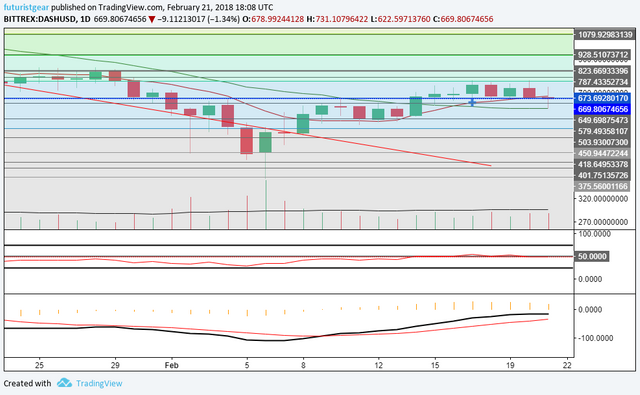
https://www.tradingview.com/x/7QxZeYJX/
Daily Chart
Dash has taken over IOTA's #10 spot (for now at least), and it looks pretty decent on the daily chart still. The MACD is on the bulls side, and the RSI is hovering around the 50 level too.
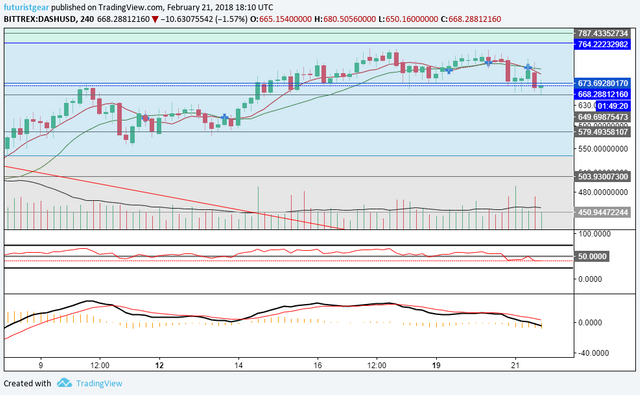
Despite the 4 hour chart favoring the bears, DASH has held up pretty well during the drop, and sports the lowest % fall out of the top ten.
The $650 support level was tested briefly and it held up well, but further resistance is ahead at $720 and $760 levels.
Summary
The signals are still pretty mixed, but Bitcoin, Litecoin ,and Dash are looking the strongest longer term right now, with XLM probably looking the weakest overall, and NEO looking the most neutral.
As always, some positive or negative news stories could send prices flying or spiraling further down, so it pays to be on the look out for that!
Speaking of which: I believe NEX news (NEO DEX) could be out soon, so NEO might be one of the coins to get a news related boos soon. If anyone can confirm/deny that? Please let me know below!
Thanks for viewing!
Want more technical analysis and crypto related posts? See also: @toofasteddie, @gazur, @ew-and-patterns, @pawsdog, @cryptomagic, @exxodus, @beiker, @lordoftruth, @masterthematrix, @cryptoheads, @tombort, @maarnio, @steemaze & @briggsy
Not intended as investment, financial, or trading advice. For entertainment purposes only.
Hi @futuristgear!
Could you add analysis of IOTA? I sold for 2.09USD/MIOTA and I'll buy it around 1,38. I'd appreciate your point of view as I'm sure IOTA's price will fall even more.
Thanks and have a nice evening or another day-time :-)
Here you go: https://busy.org/@futuristgear/4-charts-1-coin-looking-iota-a-case-study-in-time-frames
Let me know if it helps! :-D
Hi @mmaarrttiinn11, it wasn't here today because it fell to #11.
I'll do a post for you in a minute to see if I can spot anything. :-)
Congratulations! This post has been upvoted from the communal account, @minnowsupport, by FuturistGear from the Minnow Support Project. It's a witness project run by aggroed, ausbitbank, teamsteem, theprophet0, someguy123, neoxian, followbtcnews, and netuoso. The goal is to help Steemit grow by supporting Minnows. Please find us at the Peace, Abundance, and Liberty Network (PALnet) Discord Channel. It's a completely public and open space to all members of the Steemit community who voluntarily choose to be there.
If you would like to delegate to the Minnow Support Project you can do so by clicking on the following links: 50SP, 100SP, 250SP, 500SP, 1000SP, 5000SP.
Be sure to leave at least 50SP undelegated on your account.