Bitcoin - Litecoin - Dash - Ethereum - Identical Patterns Forming!
Still Correcting?
Despite a nice bounce off yesterday's lows, It seems that a lot of the major coins are still inside corrective patterns. So let's have a look at the charts for BTC, LTC, DASH and ETH to see what is happening...
Bitcoin
The downtrend line that Bitcoin ended back below after the Korean sell-off has been breached once again:
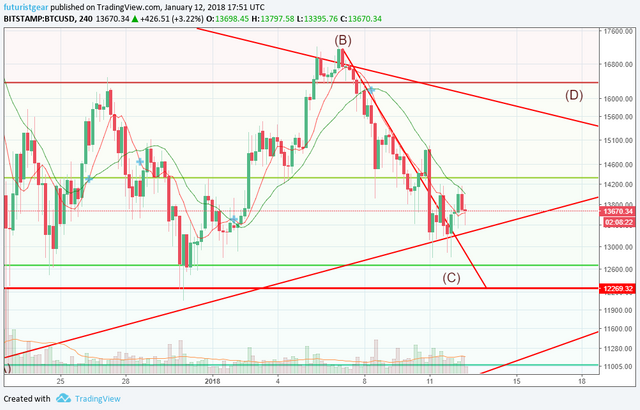
4 Hour Chart
It is always a good sign when this happens! Despite the large sell-off, Bitcoin also managed to maintain its price above the key Fibonacci level too.
You may also note that a "B" and "C" are marked? Here's why:
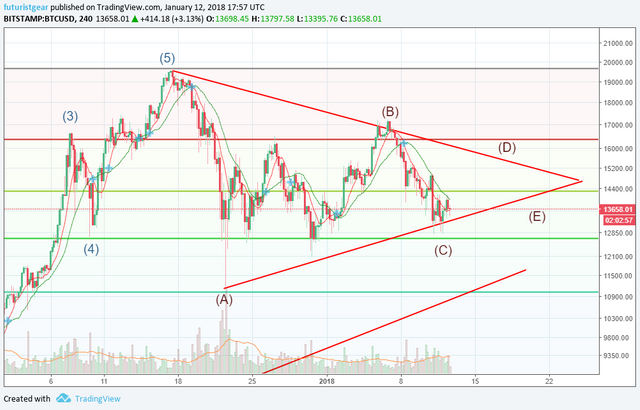
4 Hour Chart
That looks like a triangle to me!
If I have that drawn correctly, the end result of this triangle pattern should be a breakout higher and the start of a new rally for Bitcoin prices. The "D" should be hit next, before another smaller pullback to the "E" occurs.
Remember I could be very wrong!
What Else?
Bitcoin's RSI is still a little weak, but the MACD is turning more bullish on this 4 hour chart, so this could be indicating some possible upwards price moves:
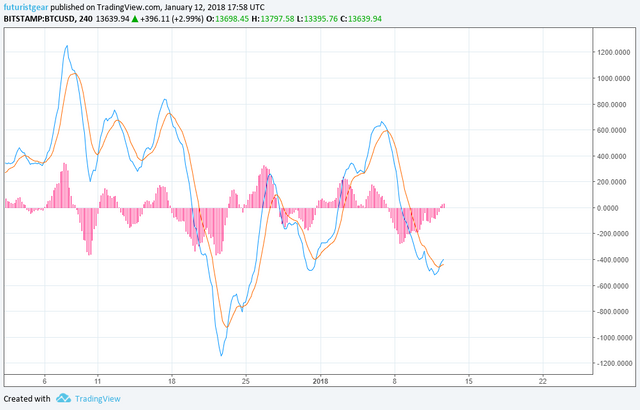
4 Hour Chart
Next up:
Litecoin
I've mentioned before that Litecoin seems to be copying Bitcoin recently, and it probably won't surprise you to see that hasn't changed:
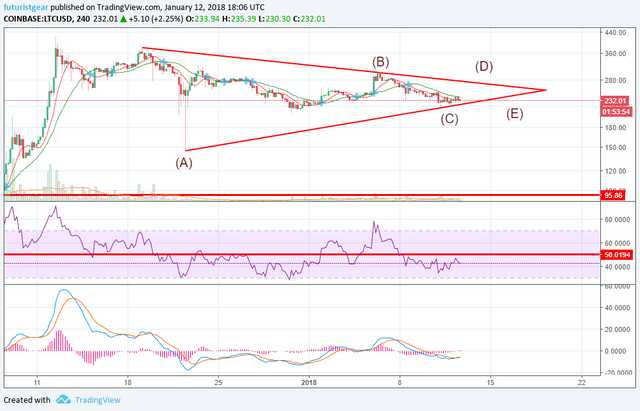
4 Hour Chart
Like BTC, the RSI is still a little weak, and the MACD appears to be turning bullish.
It also trading inside a coil/compression triangle just like Bitcoin too.
Let's have a look at:
Dash
You'll never guess what DASH is doing?
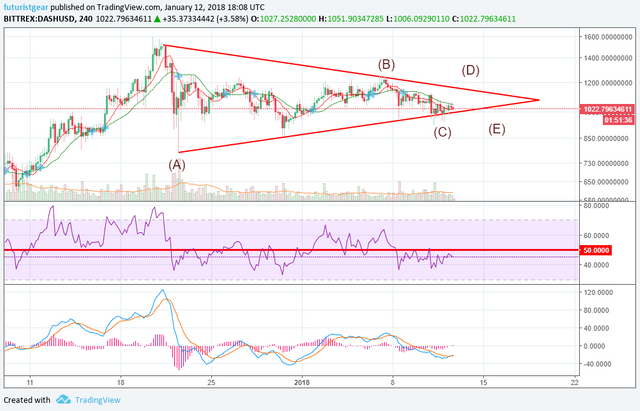
4 Hour Chart
That's right, exactly the same thing! The RSI and MACD are almost identical here too.
Considering all 3 seem to be inside similar patterns, and are all showing similar indicator levels, it wouldn't surprise me if all 3 continue to follow each other for the foreseeable future.
Things do get more interesting with ETH though:
Ethereum
Ethereum seems to have weathered the storm a lot better than some of the other major coins recently, but I'm wondering if ETH could be reaching its peak?
A Sell signal on the MA cross was given a few hours ago, but the MACD and green candles suggest that it might be ready to drop any further just yet:
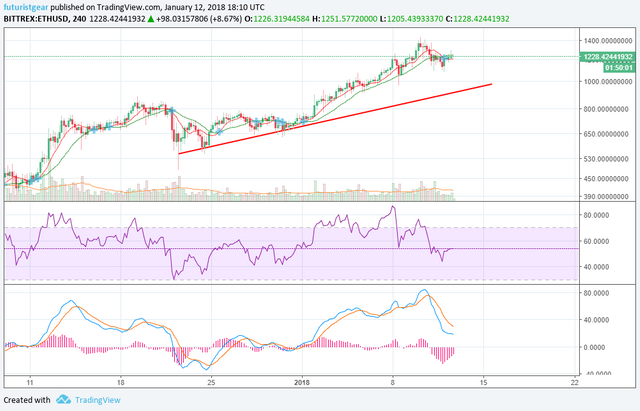
4 Hour Chart
The uptrend is still clearly very much intact here too which is a good sign, but looking at the daily chart makes me wonder if some downside price action may occur:
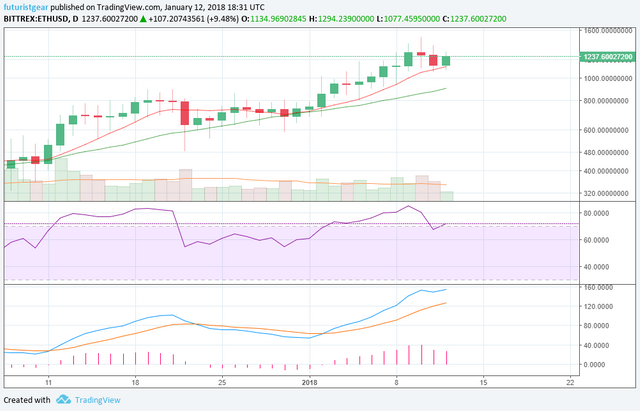
Daily Chart
Although the RSI has just about dropped down from an overbought level, things still appear a little stretched on the MACD.
I'm not saying it a correction for ETH is impending, but if I was going to add to my ETH stack? I don't think I would be doing so at the minute.
We shall see what happens! Any reason why you think Ethereum is due a correction, or why the rally isn't over yet? Let me know! I'd love to hear it.
Any thoughts on the 3 copycats welcome too!
Thanks for watching!
For more awesome technical analysis and crypto related posts, see also: @toofasteddie, @gazur, @ew-and-patterns, @pawsdog, @cryptomagic, @exxodus, @beiker, @allthereisislove, @lordoftruth, @masterthematrix, @cryptoheads, @tombort, and @maarnio
Not investment, financial, or trading advice & purely for entertainment purposes.
ETH LCT and BTC are really like brothers! Remember Ir bitcoin manage to get to the $15400 it will be probably explosion upwards!
. . . and I'm okay with that - thanks @tombort - I'm okay with BTC hitting 15400$, still a ways to go though and it seems like Bitcoin is having a hard time regaining its December glory and place in the spotlight.
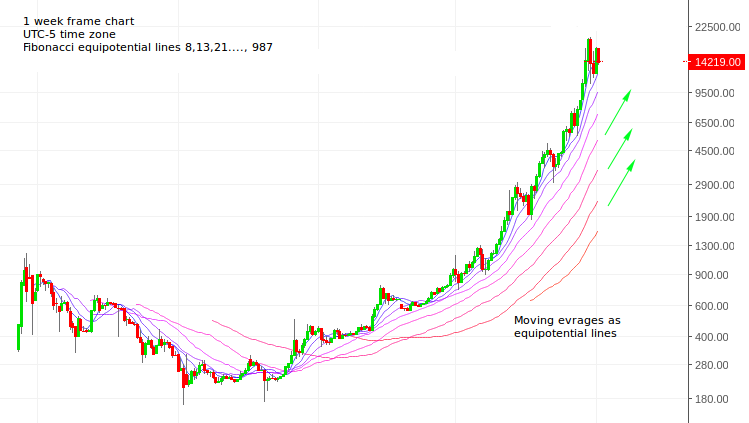
Every bullet stops once. Bitcoin will also. Think that is now facing with the second stage of his live to slow down a bit! If yo look at this chart you can get this feeling too.
 m
m
It's a day chart in logarithmic scale. so in real scale it is even steeper. This MA lines will turn downwards soon!
rough sailing this past week - too many black swans
Yeah, real massive resistance to start next impulse wave upwards. Did you read my analysis? Check it here: #27
excellent analysis @futuristgear. looks like today is shaping up to be a very warm one with lots of sunshine and warm weather. unless any black swans fly by we should see some nice growth today
following your posts with interest
Great analysis as always! Big question: what the heck is going on with EOS?? I'm not complaining because I have some but would love to see your analysis there.
Thank you very much @beauknows!
It seems like EOS was in a similar pattern to some of those above until recently, so that is probably why it went on a nice rally.
I'm wondering if it could be the start of a new set of waves higher too after counting them on the daily chart:
It looks like it might be a little bit overbought short term right now though, so maybe it'll pull back a little bit.
I should probably start charting EOS. I might split them up into posts of 2-3 different currencies perhaps and give that a try. I'll do the first one tomorrow if I can. :-)
I can make analysis for EOS to if you want! Check and Follow my blog!
You should definitely do some EOS @tombort! I'd like to see if we have similar thoughts. :-D