Bitcoin Price Weekly Analysis – Can BTC/USD Capitalize Further?

Key Points
- Bitcoin price formed a major bottom at the $9096 low and recovered well against the US Dollar.
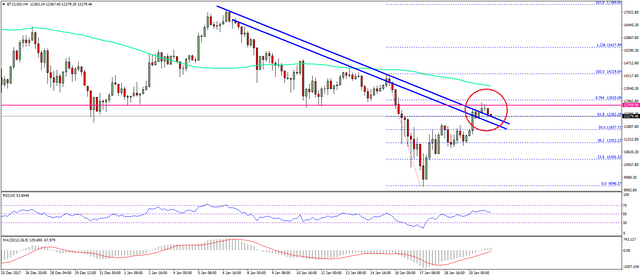
- The BTC/USD pair is currently attempting to settle above two bearish trend lines with resistance at $12,250 on the 4-hours chart (data feed from SimpleFX).
- The price must settle above the $12800 level to gain upside momentum in the near term.
Bitcoin price is gaining momentum above $11,500 against the US Dollar. BTC/USD is trading with a positive bias and it looks set to break the $12,800 resistance.
Bitcoin Price Resistance
After a major decline, bitcoin price was able to find buyers below the $10,000 level against the US Dollar. A low was formed at $9096 from where an upside recovery was initiated. The price moved higher and was able to trade above the $10,000 resistance. There was a break above the 23.6% Fib retracement level of the last decline from the $14,219 high to $9096 low.There are many positive signs on the chart above $11,000. More importantly, the price is above the 50% Fib retracement level of the last decline from the $14,219 high to $9096 low. At the moment, the BTC/USD pair is currently attempting to settle above two bearish trend lines with resistance at $12,250 on the 4-hours chart. It is positive sign above $12,000. However, the pair has to settle above the $12,800 level to gain upside momentum. Moreover, the price should clear the 61.8% Fib retracement level of the last decline from the $14,219 high to $9096 low at $13,010.Overall, it looks like the pair is around a crucial juncture below $13,000.

Should bitcoin succeeds in moving above $13,000, there could be more gains in the near term above $15,000.Looking at the technical indicators: 4-hours MACD – The MACD is now slowly moving in the bullish zone.4-hours RSI (Relative Strength Index) – The RSI is just above the 50 level and is moving down slowly.Major Support Level – $11,000Major Resistance Level – $13,000