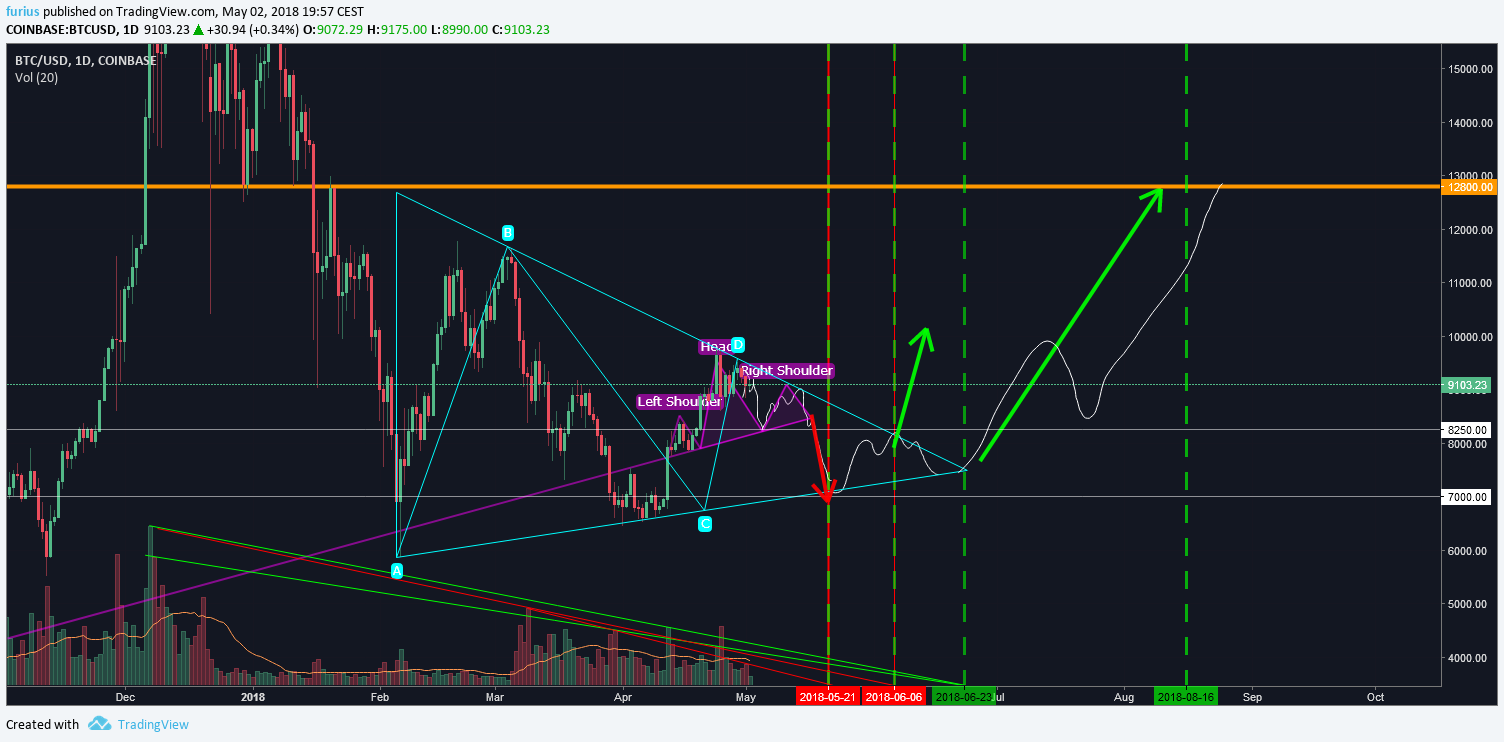
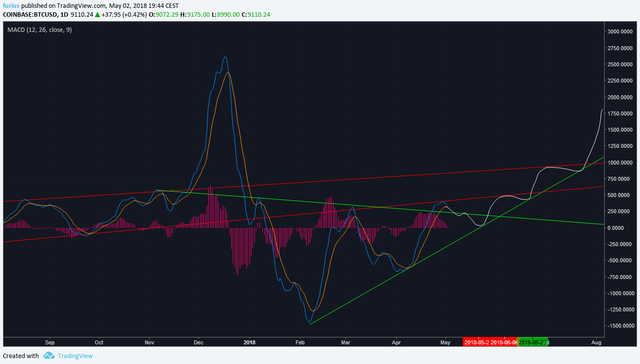
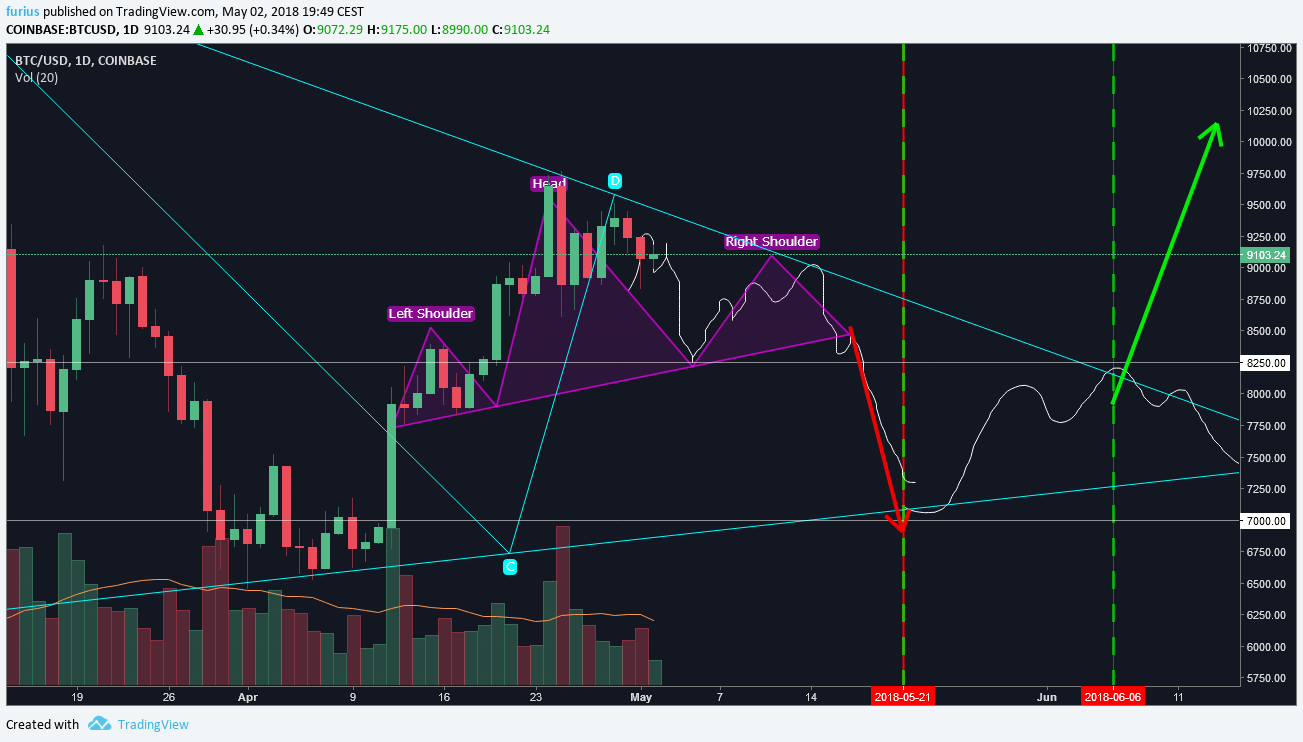
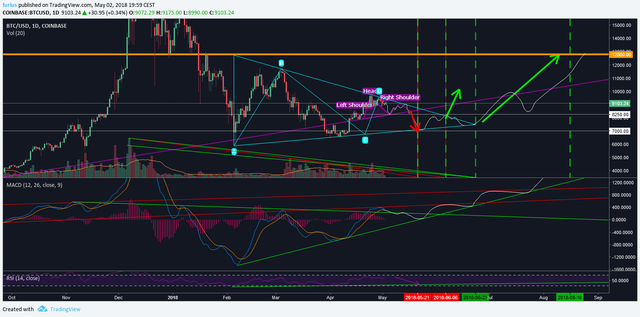
BTC/USD Going Down to finish the triangle.. Daily MACD dictates!

MACD has crossed over on the Daily chart , and bounced off the long term pressure line(red rising line).. Have a look on the MACD .. it's quite self explanatory..

Volume indicates some trend changes on the time line (red/green spotted lines) they corelate with the pattern on MACD and furthermore confirm the triangle pattern .
I marked HnS pattern which is currently finishing the head phase..that should bring us down to 7k level .. a good place to open a long position.. In case the breakout happens before the very apex of the triangle - Green Arrow//
My target as a result of the triangle pattern 12.8k..
https://www.tradingview.com/chart/BTCUSD/g32BgzeX-Going-Down-to-finish-the-triangle-Daily-MACD-dictates/
.. link to tradingview for updates..
This is my hobby so take it or leave it :D
All the best


Excelente tu análisis del btc, amigo gracias por compartir!
Saludos! :)
Gracias Carla ! No salio exactamente asi en fin.. a ver si va a bajar hasta $7k :D Que tengas un buen dia!
Si pero igualmente se valora que lo hayas realizado yo no sé nadita de eso.
Gracias ten un lindo día igual :)