Bitcoin Lines up for a Juicy Long 📈

Hey guys,
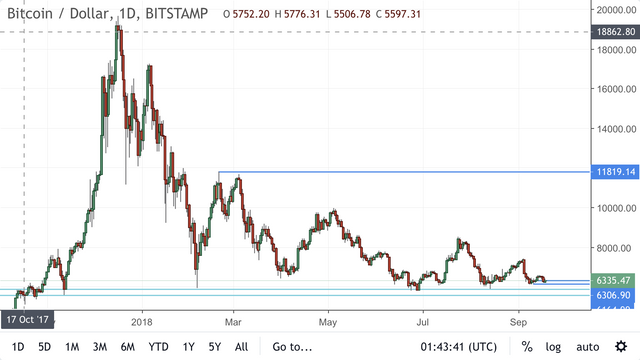
I’ve spoken about the fact that Bitcoin is forming a bit of a base on the higher time frame, something you can see on the following zoomed out daily chart:
BTC/USD Daily
This chart just highlights the key higher time frame support/resistance zone that’s been tested in both directions since way back. It’s a highly significant level and shows why price is having a hard time breaking through.
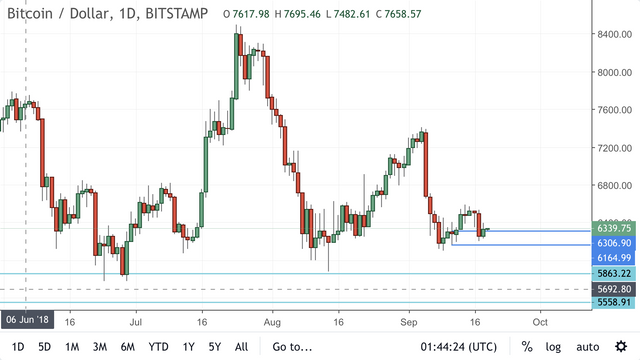
Now staying in the daily, I just wanted to show the way price has reacted after bouncing off it this most recent time:
BTC/USD Daily Zoomed
You can see that after holding the level, price paused before retesting it and then moving higher. I see this little retest as confirmation that the higher time frame zone has in fact held and therefore, I want to be looking for longs.
So into the intraday charts we go:
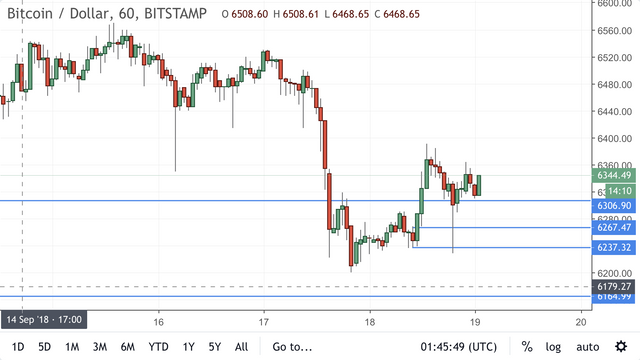
BTC/USD Hourly
The hourly chart shows another retest of short term resistance turned support and this is our entry signal. With price holding above the higher time frame level, things have lined up for another long entry.
Peace ✌🏻.
@forexbrokr | Steemit Blog
Forex and Crypto Market Musings.
Twitter: @forexbrokr
Instagram: @forexbrokr


The chart looks so weird now lol
In what way?
Posted using Partiko iOS
Looks nice, green today too. What do you see as the short-term resistance levels ?
Just gotta get above that 6400 swing high first. That’ll be a nice intraday higher high and confirm the price action.
Posted using Partiko iOS
2 for day 7. Thank you so much for supporting the Australian Farmers with your raffle purchase. And so nice to kinda meet you 😄
thank you for your support..and this work is spot on!! following as well.