Cloud mining profitability vs CPE mining UPDATE #7
Cloud mining profitability vs CPE mining UPDATE #7
In this update I've added new gears: ASIC M3 (SHA-256) and GPU 1070. Also I've added new currencies Bitcoin Cash BCH (SHA-256) and Bitcoin Gold BTG (Equihash). Bitcoin Cash could compete with BTC for miners profitability on SHA-256. Bitcoin Gold is a new coin for GPU mining with algorithm similar to ZCash.
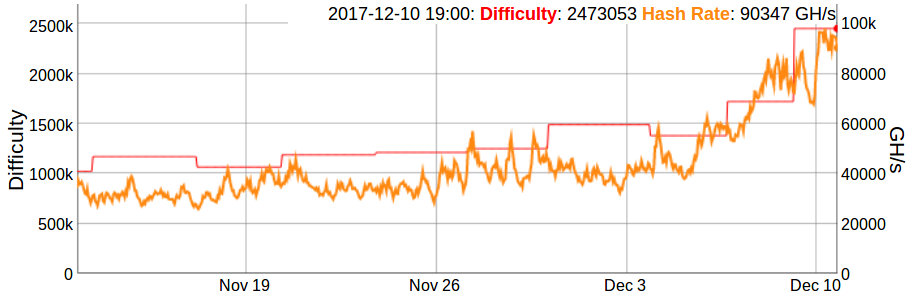
Some changes has occurred from my last report a week ago. Bitcoin has climbed 18K$ level and rebounded to 15K$! ASIC miners for SHA-256 become more expensive on the market. Bitcoin mining difficulty continue to grow.
During last 2 weeks Litecoin network difficulty doubling. Could LTC repeat the story with DASH 50x hashrate?
So, we have following parameters at the current mining difficulty level:
|              | rate     |      coins |     price |      mine |       maint |
|--------------+----------+------------+-----------+-----------+-------------|
| BTC-HF       | 10 GH/s  | 1.58e-06   | 1         | 1.5       | 0.0035      |
| BTC-ASIC-M3  | 10 GH/s  | 1.58e-06   | 1         | 1.82756   | 0.00285807  |
| BTC-ASIC-S9  | 10 GH/s  | 1.58e-06   | 1         | 2.2155    | 0.00160817  |
| BCH-ASIC-M3  | 10 GH/s  | 1.986e-05  | 0.0850916 | 1.82756   | 0.00285807  |
| BCH-ASIC-S9  | 10 GH/s  | 1.986e-05  | 0.0850916 | 2.2155    | 0.00160817  |
| ETH-HF       | 100 KH/s | 1.6792e-05 | 0.0290708 | 2.2       | 0           |
| ETH-GPU-1060 | 100 KH/s | 1.6792e-05 | 0.0290708 | 1.65725   | 0.000657356 |
| ETH-GPU-1070 | 100 KH/s | 1.6792e-05 | 0.0290708 | 1.87571   | 0.000657356 |
| ZEC-HF       | 1 H/s    | 1.586e-05  | 0.0198082 | 2         | 0           |
| ZEC-GPU-1060 | 1 H/s    | 1.586e-05  | 0.0198082 | 1.38104   | 0.000547797 |
| ZEC-GPU-1070 | 1 H/s    | 1.586e-05  | 0.0198082 | 1.30863   | 0.00045862  |
| BTG-GPU-1060 | 1 H/s    | 2.68e-05   | 0.0142608 | 1.38104   | 0.000547797 |
| BTG-GPU-1070 | 1 H/s    | 2.68e-05   | 0.0142608 | 1.30863   | 0.00045862  |
| LTC-HF       | 1 MH/s   | 0.00020336 | 0.0098364 | 7.5       | 0.005       |
| LTC-ASIC-L3+ | 1 MH/s   | 0.00020336 | 0.0098364 | 5.42373   | 0.00262942  |
| DASH-ASIC-D3 | 1 MH/s   | 3.3e-07    | 0.0448685 | 0.0966102 | 0.000131471 |
| XMR-GM       | 1 H/s    | 1.08e-05   | 0.0158806 | 0.833     | 0           |
| XMR-GPU-1060 | 1 H/s    | 1.08e-05   | 0.0158806 | 0.867166  | 0.000267529 |
| XMR-GPU-1070 | 1 H/s    | 1.08e-05   | 0.0158806 | 1.12542   | 0.000328678 |

Columns:
rate  - Unit rate for calculation
coins - Coins generation per unit rate (from online calculators)
price - Price per coin in BTC (from Coinmarketcap)
mine  - Daily mining cost per unit rate, USD
maint - Daily maintenance fee per unit rate, USD
ASIC-M3 miner has less hashrate in comparison to ASIC-S9 and more power consumption. Let's see is it more effective per USD invested.
Mining profit calculation (BTC - 15652 USD):
invest fee earn ratio revenue maintenance \
BTC-HF 100 0.233333 1.64869 1.41535 601.771 85.1667
BCH-ASIC-M3 100 0.156387 1.44733 1.29094 528.274 57.0813
BTC-ASIC-M3 100 0.156387 1.35319 1.1968 493.913 57.0813
BCH-ASIC-S9 100 0.0725875 1.1939 1.12131 435.773 26.4945
BTC-ASIC-S9 100 0.0725875 1.11624 1.04366 407.429 26.4945
LTC-ASIC-L3+ 100 0.04848 0.577267 0.528787 210.702 17.6952
BTG-GPU-1070 100 0.0350458 0.457124 0.422078 166.85 12.7917
ETH-GPU-1060 100 0.0396655 0.461046 0.42138 168.282 14.4779
BTG-GPU-1060 100 0.0396655 0.433156 0.393491 158.102 14.4779
ETH-GPU-1070 100 0.0350458 0.40735 0.372304 148.683 12.7917
LTC-HF 100 0.0666667 0.417458 0.350792 152.372 24.3333
ETH-HF 100 0 0.347304 0.347304 126.766 0
ZEC-GPU-1070 100 0.0350458 0.375754 0.340708 137.15 12.7917
XMR-GM 100 0 0.322269 0.322269 117.628 0
ZEC-GPU-1060 100 0.0396655 0.356052 0.316387 129.959 14.4779
XMR-GPU-1060 100 0.0308509 0.309572 0.278721 112.994 11.2606
ZEC-HF 100 0 0.245862 0.245862 89.7395 0
XMR-GPU-1070 100 0.0292048 0.238532 0.209327 87.0643 10.6598
DASH-ASIC-D3 100 0.136084 0.239886 0.103802 87.5585 49.6707
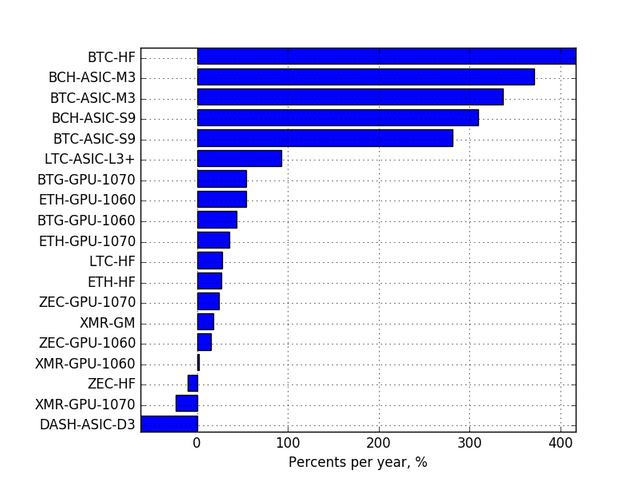
profit return percent
BTC-HF 416.604 2.36667 416.604
BCH-ASIC-M3 371.193 2.6 371.193
BTC-ASIC-M3 336.832 2.8 336.832
BCH-ASIC-S9 309.279 3 309.279
BTC-ASIC-S9 280.934 3.2 280.934
LTC-ASIC-L3+ 93.0071 6.33333 93.0071
BTG-GPU-1070 54.0584 7.9 54.0584
ETH-GPU-1060 53.8037 7.93333 53.8037
BTG-GPU-1060 43.6241 8.5 43.6241
ETH-GPU-1070 35.8909 8.96667 35.8909
LTC-HF 28.0389 9.53333 28.0389
ETH-HF 26.7658 9.6 26.7658
ZEC-GPU-1070 24.3584 9.8 24.3584
XMR-GM 17.6281 10.3667 17.6281
ZEC-GPU-1060 15.4812 10.5667 15.4812
XMR-GPU-1060 1.73304 11.9667 1.73304
ZEC-HF -10.2605 NaN -10.2605
XMR-GPU-1070 -23.5955 NaN -23.5955
DASH-ASIC-D3 -62.1123 NaN -62.1123
Columns:
invest - Calculate profit per each 100 USD investment
fee - Daily expenses per purchase rate, USD
earn - Daily revenue per purchase rate, USD
ratio - Daily profit per invested 100 USD
revenue - Revenue per year, USD
maintenance - Maintenance fee per year, USD
profit - Profit per year, USD
return - Return of investment (ROI), months
percent - Return percent per year, USD
ASIC-M3 looks more effective than ASIC-S9 and BCH mining is more profitable than BTC. GPU-1070 is more profitable than GPU-1060 for Equihash (BTG, ZEC), but GPU-1060 is better to use for Ethash (ETH) and Cryptonight (XMR). DASH ROI is more than 1 year due to extremely high hashrate growth.
We could compare some values with a real payouts from Hashflare mining:
     usd_100      roi
BTC     1.44      2.3
ETH     0.35      9.6
LTC     0.14     23.2
The column "usd_100" shows daily profit per 100 USD investment. As you could see, the BTC profit and ROI are comparable with the calculated above values, but why LTC profit is so low on Hashflare!
The calculation was done with assumption of constant price and difficulty level. Be aware that cloud mining providers could change voluntary contracts rules (Hashflare did it at Sept. 1). This is just my personal research and not an investment advise. I'm not affiliate to any mining company.
great post @fooblic
Thanks a lot!