Understanding the Stoch & Rsi tools on Trading view
hey guys on this post i want to explain the Stoch and Rsi analysis tools and how they can benefit you in my opinion these 2 tools are some of the best in the arsenal when trying to predict the market and ill show you why
"The Relative Strength Index (RSI), developed by J. Welles Wilder, is a momentum oscillator that measures the speed and change of price movements. The RSI oscillates between zero and 100. Traditionally the RSI is considered overbought when above 70 and oversold when below 30." - google
awesome now that you know what the RSI of a stock is how do we use it for crypto? well first your going to select the RSI tool and go to properties crypto is alot different than traditional stocks so we will have to edit the value of the RSI to 4 (this works wonders for me play around with it if you would like ) also edit the "style" section to upper 75 lower 25
HOW TO USE THE RSI TO BUY ??
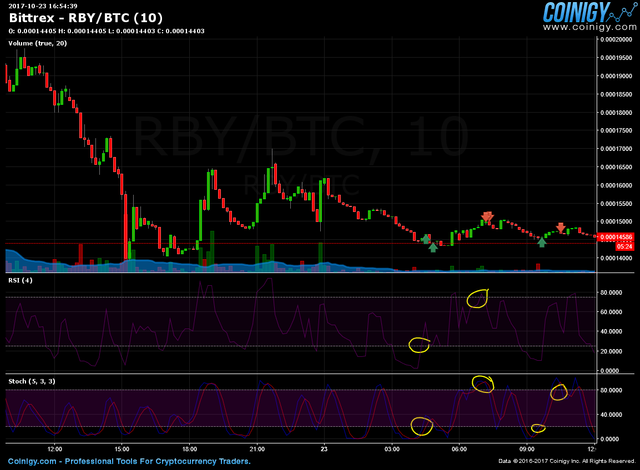
the main thing you are looking at the rsi for is going to be optimal buy and selling points , if you look at image 1 the lower graph is the RSI , you will notice on the actual chart for btc/usd that at 19:00 there was a dump of coins , now if you look down at the rsi you can determine the most optimal buy in notice that at the 19:00 section of the rsi just before it actually the stock itself crossed down below 25 points this is the main indicator we are looking for however it is not the right time to buy yet ! , notice that just at the 19:00 time chart the rsi crossed above 25 points this is the most optimal buy time for the stock because it has decreased in value and is showing a good sign of an upward trend
HOW TO USE THE STOCH TO BUY ???
what is stock ? heres google again :) "In technical analysis of securities trading, the stochastic oscillator is a momentum indicator that uses support and resistance levels. Dr. George Lane developed this indicator in the late 1950s. The term stochastic refers to the point of a current price in relation to its price range over a period of time."
setting up the stoch for crypto : edit the properties to 5,3,3 leave the rest alone
ok now if you notice just before the 19:00 time frame the stoch went below the 20 point mark you read these indicators almost identically except that rsi needs to cross 25 and stoch needs to cross 20 now when the stoch is showing a movement above 20 that is the best time to buy in
USING THEM TOGETHER!!!!!
these tools work best in unison , if you notice on image 1 that when the stoch and rsi indicators crossed 20 and 25 and re entered you would have bought in on btc/usd @ 4160 now look at chart 2 for the sell i will go over the details in the selling with both section :)
Selling with these wonderful indicators
ok so now you have got the gist of buying with rsi and stoch indicators now wait .. where do i sell my new coins???
well luckily for you the same indicators work both ways but at different levels yet again :P
RSI TO SELL : 75 and wait for 75 re entry
STOCH TO SELL: 80 and wait for 80 re entry
now if you look at image 2 you remember that btc you got for 4160? , ok its about that time to make a small profit if you notice that when the rsi and stoch indicated OVER BOUGHT (i will leave a description at the bottom of the post for easy to remember use ) the stock itself started to gain rather quickly to around 4240 , the stoch and rsi indicators also re entered rather quickly into their respected values this indicated a SELL , at this point you should have the coins ready to sell and typed in waiting for a price when you see the indicators cross that is the perfect chance to catch the best price for a sell from your coin in this case you would have made 70$ on other stocks this method works great i am using btc as an example because it is a high volume easy to use stock for analysis
NOTES:
rsi indicator for overbought : above 75
rsi indicator for oversold : under 25
Stoch indicator for overbought : above 80
Stoch indicator for oversold : under 20
remember the most optimal point for buying or selling is when BOTH graphs line up one may not be the same as the other if this is the case just wait it out you would rather profit than suffer from an impulse buy thats now 100 $ over priced :)
and again if any one needs me to analyse a chart or a stock just let me know and i would be glad to give optimal entry points and sell points so you too can live in the green enjoy and happy trading i hope this helped you arm up your trading tools
image 1

Image 2

Congratulations @featherbtc! You have completed some achievement on Steemit and have been rewarded with new badge(s) :
Click on any badge to view your own Board of Honor on SteemitBoard.
For more information about SteemitBoard, click here
If you no longer want to receive notifications, reply to this comment with the word
STOPAwesome @featherbtc
I would like to express my deepest appreciation for the quality content!
I've tried out your guide and here is the result:
https://www.coinigy.com/s/i/59ee1ecf3e849/