Collective Bitcoin Technical Analysis [31 July 2018]
A no bulshit Bitcoin summary aggregated from Tone Vays, Alessio Rastani, Tyler Jenks, Blog Prezesa, for all of you who have no time to watch their insightful videos.
~ NEW ~
Tone Vays [31 July 2018]
Had we fallen to $5,000 back in July like he expected, he would have looked for a bounce to the Dearth Cross area and then a break down below the $5,000 next time we went there. But because we turned around at $5,750 it created a weird situation where he is not confident that there will be a significant bounce off $5,000 that it would have been if we had fallen there in July. That bounce off $5,000 he would expected is the bounce we have just completed. So we are more likely to fall through $5,000. Once we go lower than $7,000 there's no support until $5,000 so it's now or never for Bitcoin to reverse the Bear trend. If we can't hold $7,750 he believes it's going for the new lows. source
~ CURRENT VIEW ~
Tone Vays [30 July 2018]
The official Death Cross definition is using 50 and 200 moving averages, Tone is using 30 and 50 moving averages because Bitcoin has barely been around for 200 weeks. He admits that this was a strong bounce but now the moving averages are nearly crossing over and he doesn't think that price will be able to go above them, so he expects it to start going down soon. Additionally Willy Woo's fundamental perspective for the next 6 months gives a similar BEARISH price outlook. source
Alessio Rastani [30 July 2018]
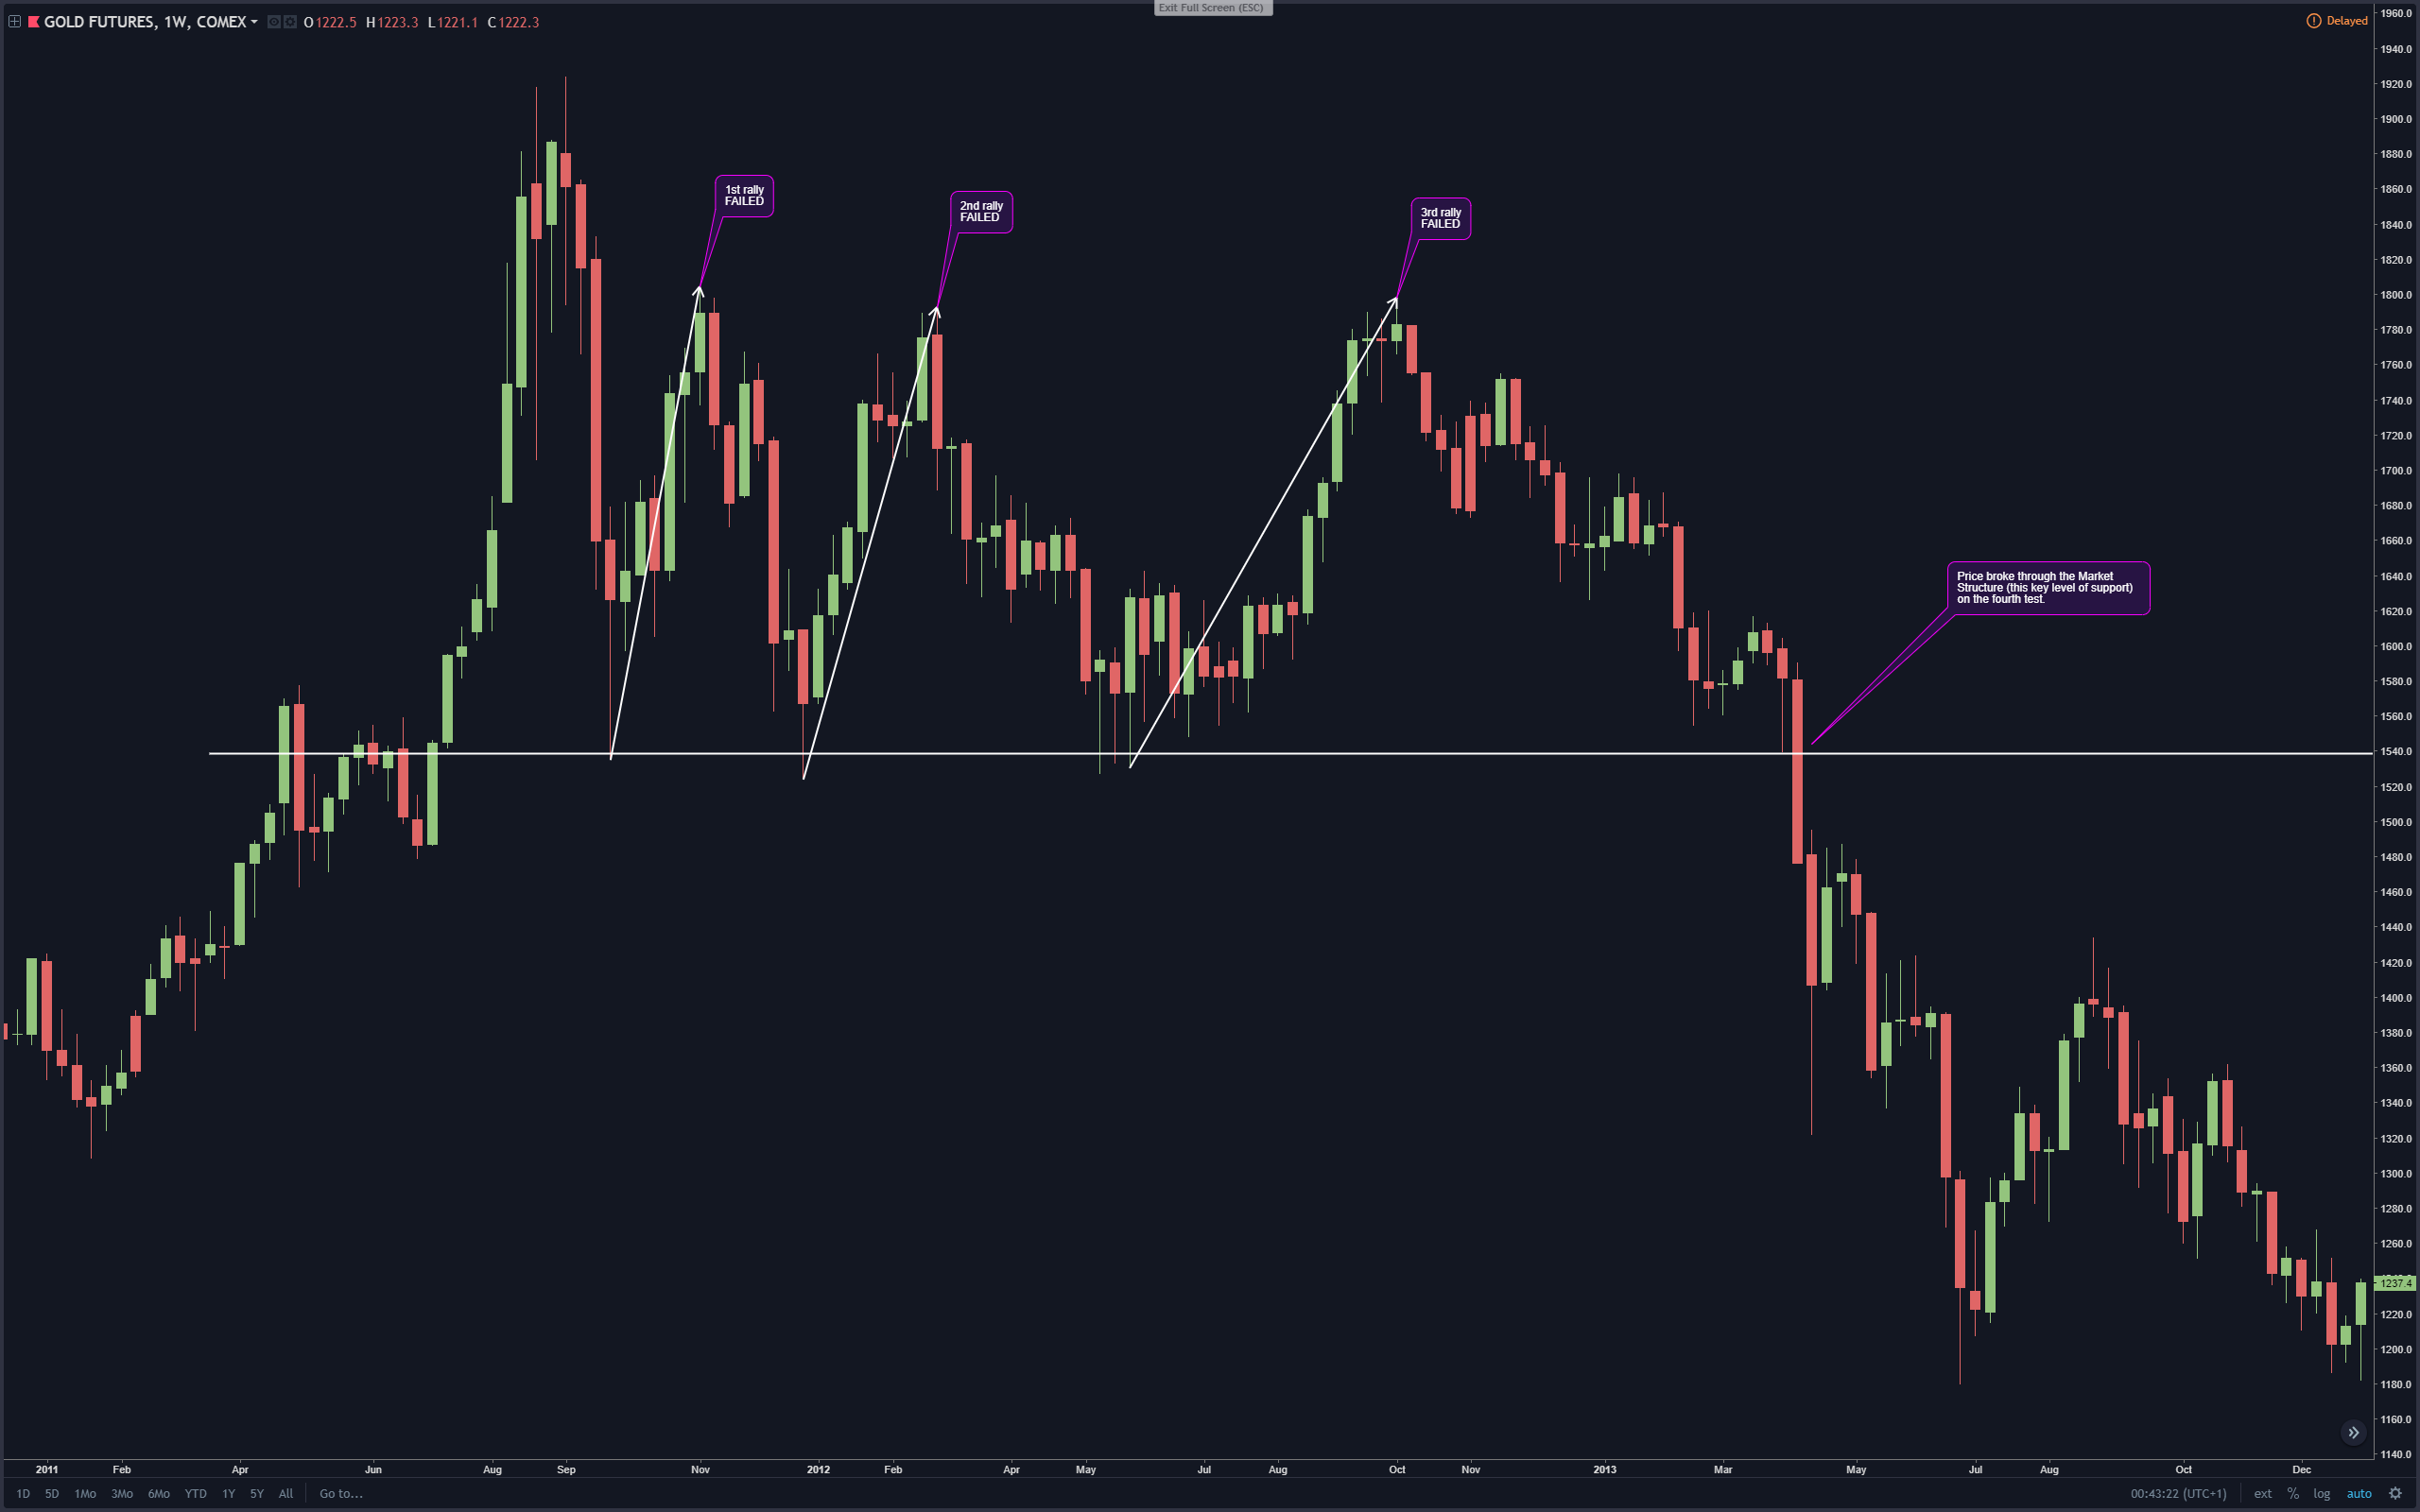
Bitcoin is currently in very similar situation like Gold was in 2013, when after three failed rallies price finally broke through it's key support level (Market Structure) and fell well below it. Alessio believes that this is Bitcoin's last chance, it's 3rd rally that must not fail if it doesn't want to share Gold's fate, he does believe that this is a beginning of an upward trend and a BULL market. But if Bitcoin was going to come back down to it's key support level, and he doesn't believe that it will, BUT IF it was, it will break through it and potentially go to $5,000 or maybe even as low as $3,000.
"Markets can be very generous at giving you 2nd and 3rd chances… but they are stingy with 4th and 5th chances" source
Tyler Jenks [27 July 2018]
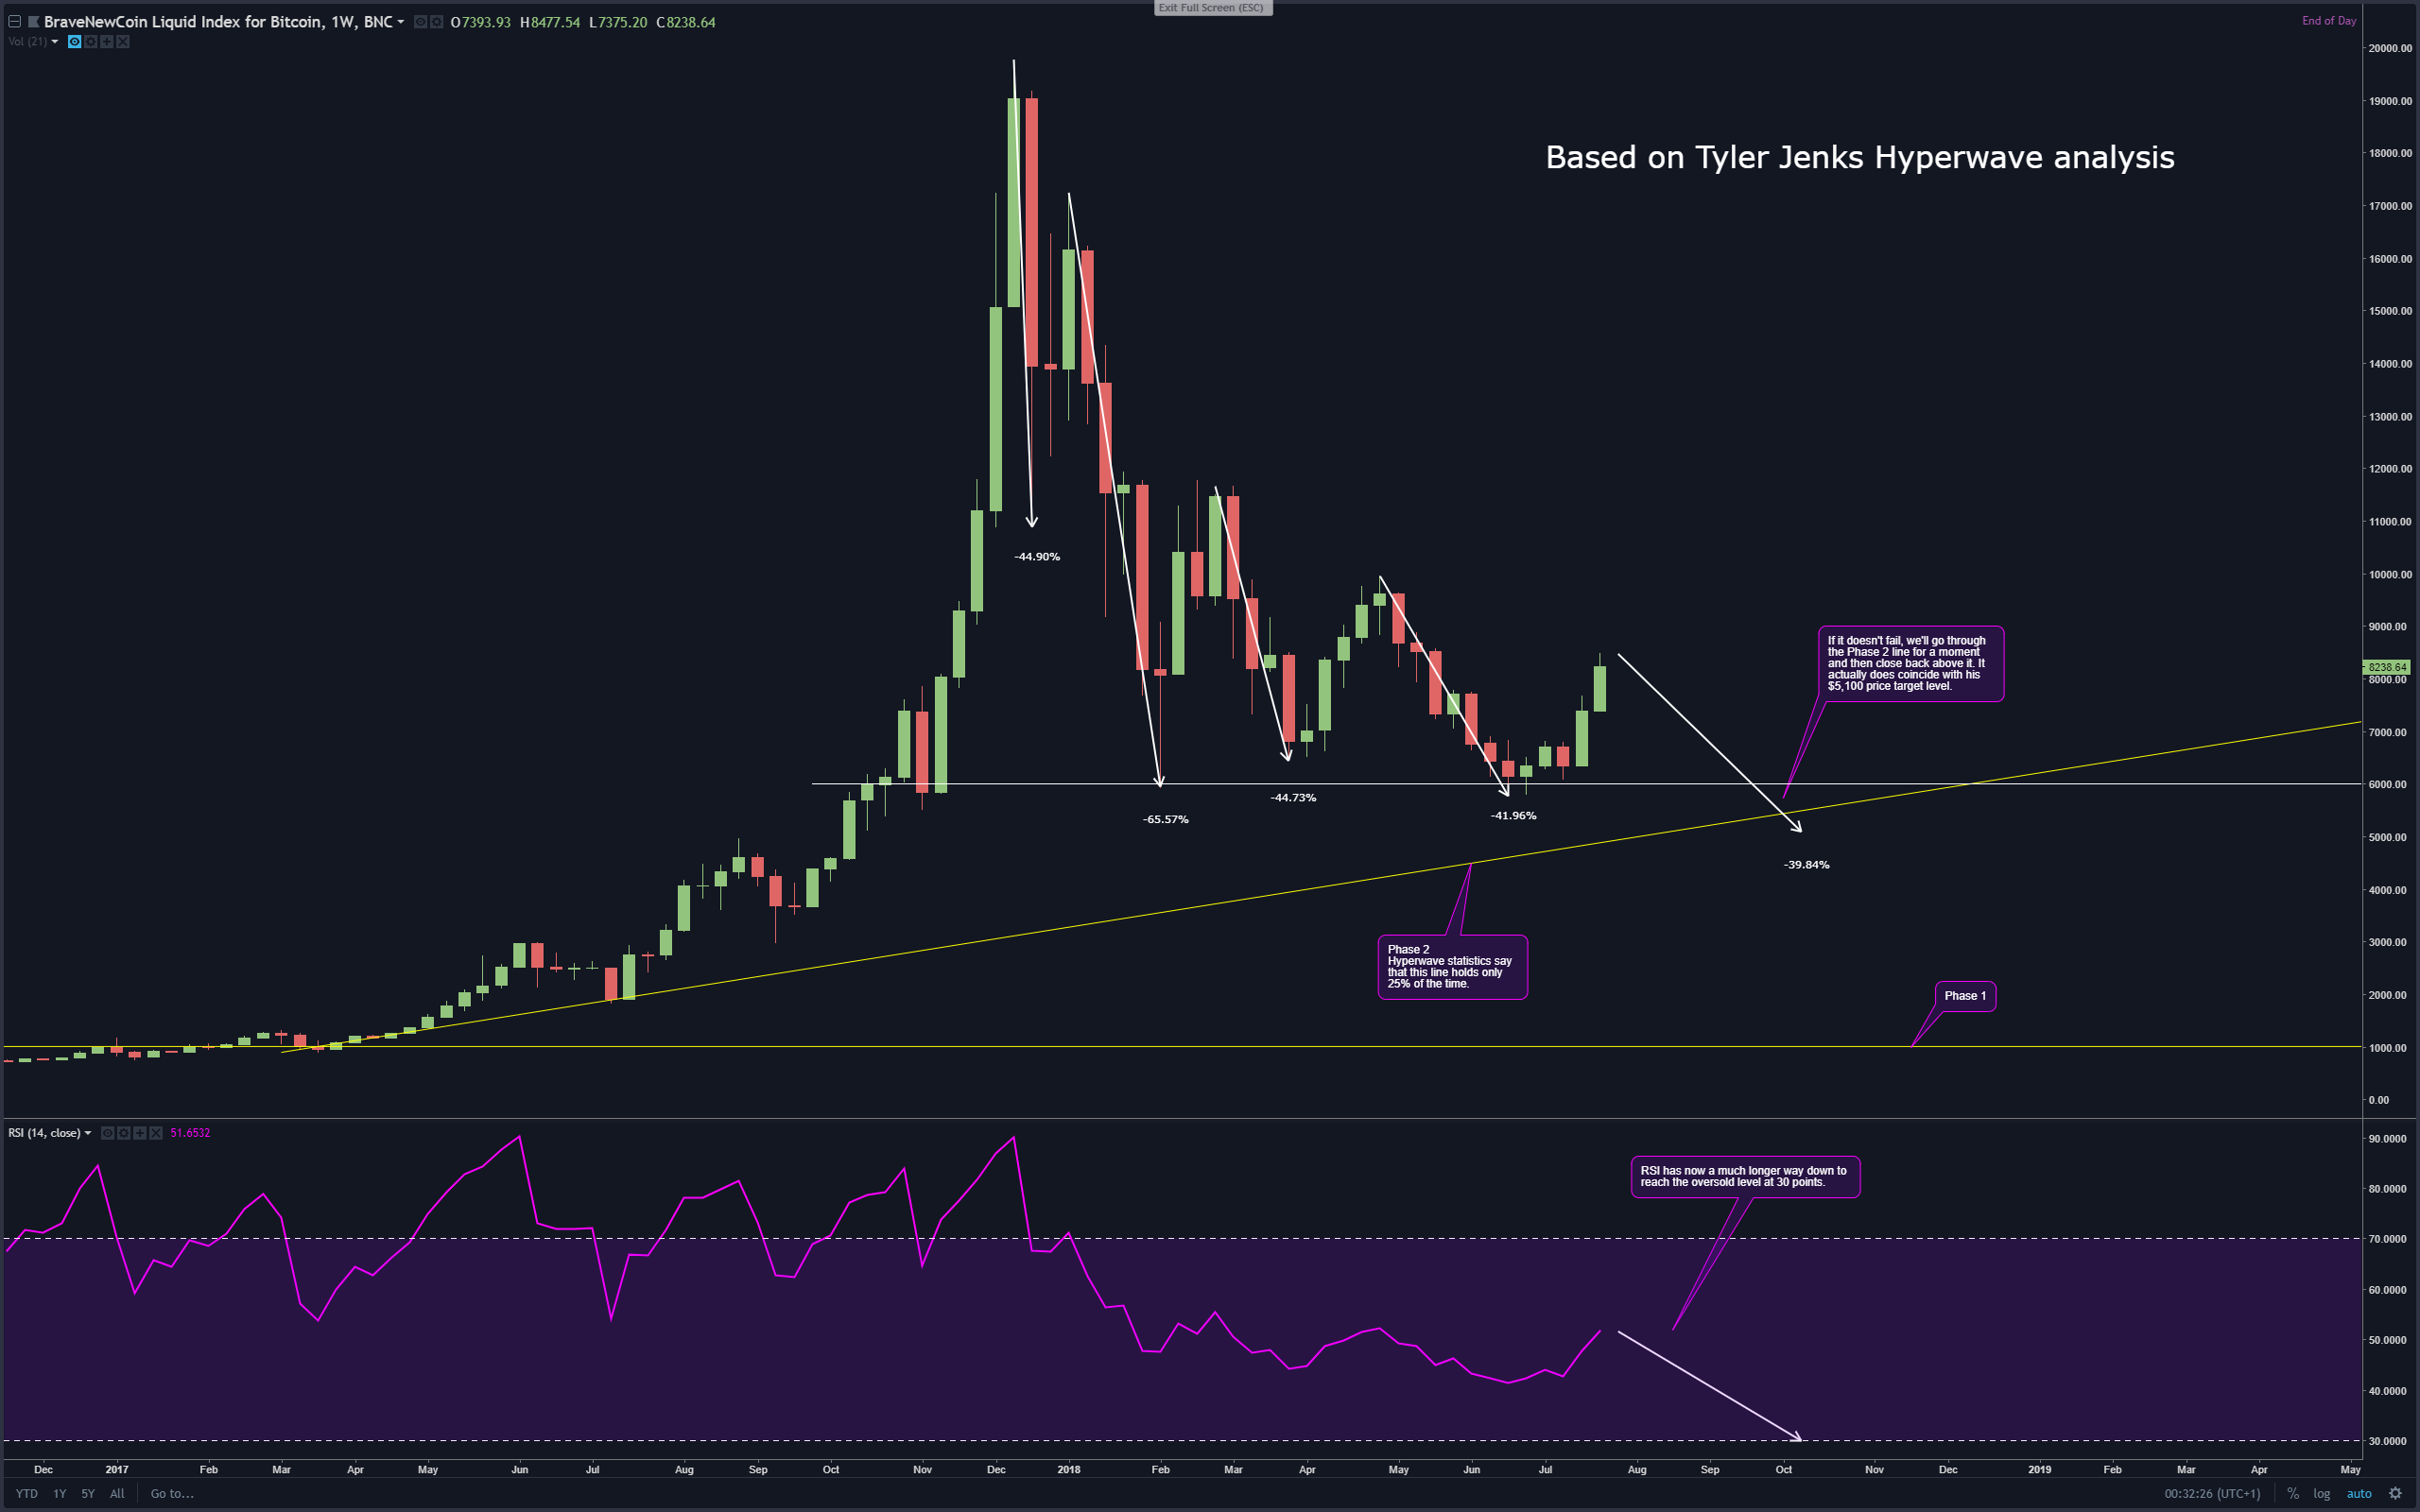
On the WEEKLY time scale his current view is BEARISH. Nothing has changed, both SAR and BB are still pretty much the same as they were. The RSI has risen a little to about 52 but it only means that it'll have a longer way down, meaning that the drop will be larger and will last longer until the oversold region is reached. He believes that we'll drop at least to the Phase 2 line of his Hyperwave, which is going to be at around $5,100 within the next 5 weeks. If it doesn't hold and we break through it, then this Hyperwave has failed and there is no other support levels below and the drop to the Phase 1 line at $1,000 is quite likely. source
Is it possible that this is the ultimate bottom of the Hyperwave at $5,700? Yes it's possible, but Tone Vays has given it 5 or 10%. Tyler doesn't believe it's a probable bet, not even a reasonable possible bet, but it is possible, so he gives it 10, maybe even as high as 20% chances. source
On a DAILY time scale his current view is NEUTRAL he thinks that a one more try of an upswing is possible from the most recent 4 daily candles formation where a recent down trending channel has formed in the last 3 days.
Blog Prezesa [23 July 2018]
Bounce we are in since the 16th of July is probably only a correction,it will be short lived and we'll soon continue moving downwards again. Recent Altcoins weakness suggest that the most of the money has been moved to Bitcoin. It's worth mentioning that in 2015 during the previous bubble formation, in the beginning only Bitcoin was gaining for a long time before Dash joined in and after that again it took awhile for the rest of the coins to joined the party. This is quite similar to what's happening at the moment, it may be a normal behaviour for this market, first Bitcoin is pumped and when there is a lot of cash already in it, it'll start spilling over the rest of the Alts, so this could mean a possibility of a change in a trend. source
My two cents on the matter
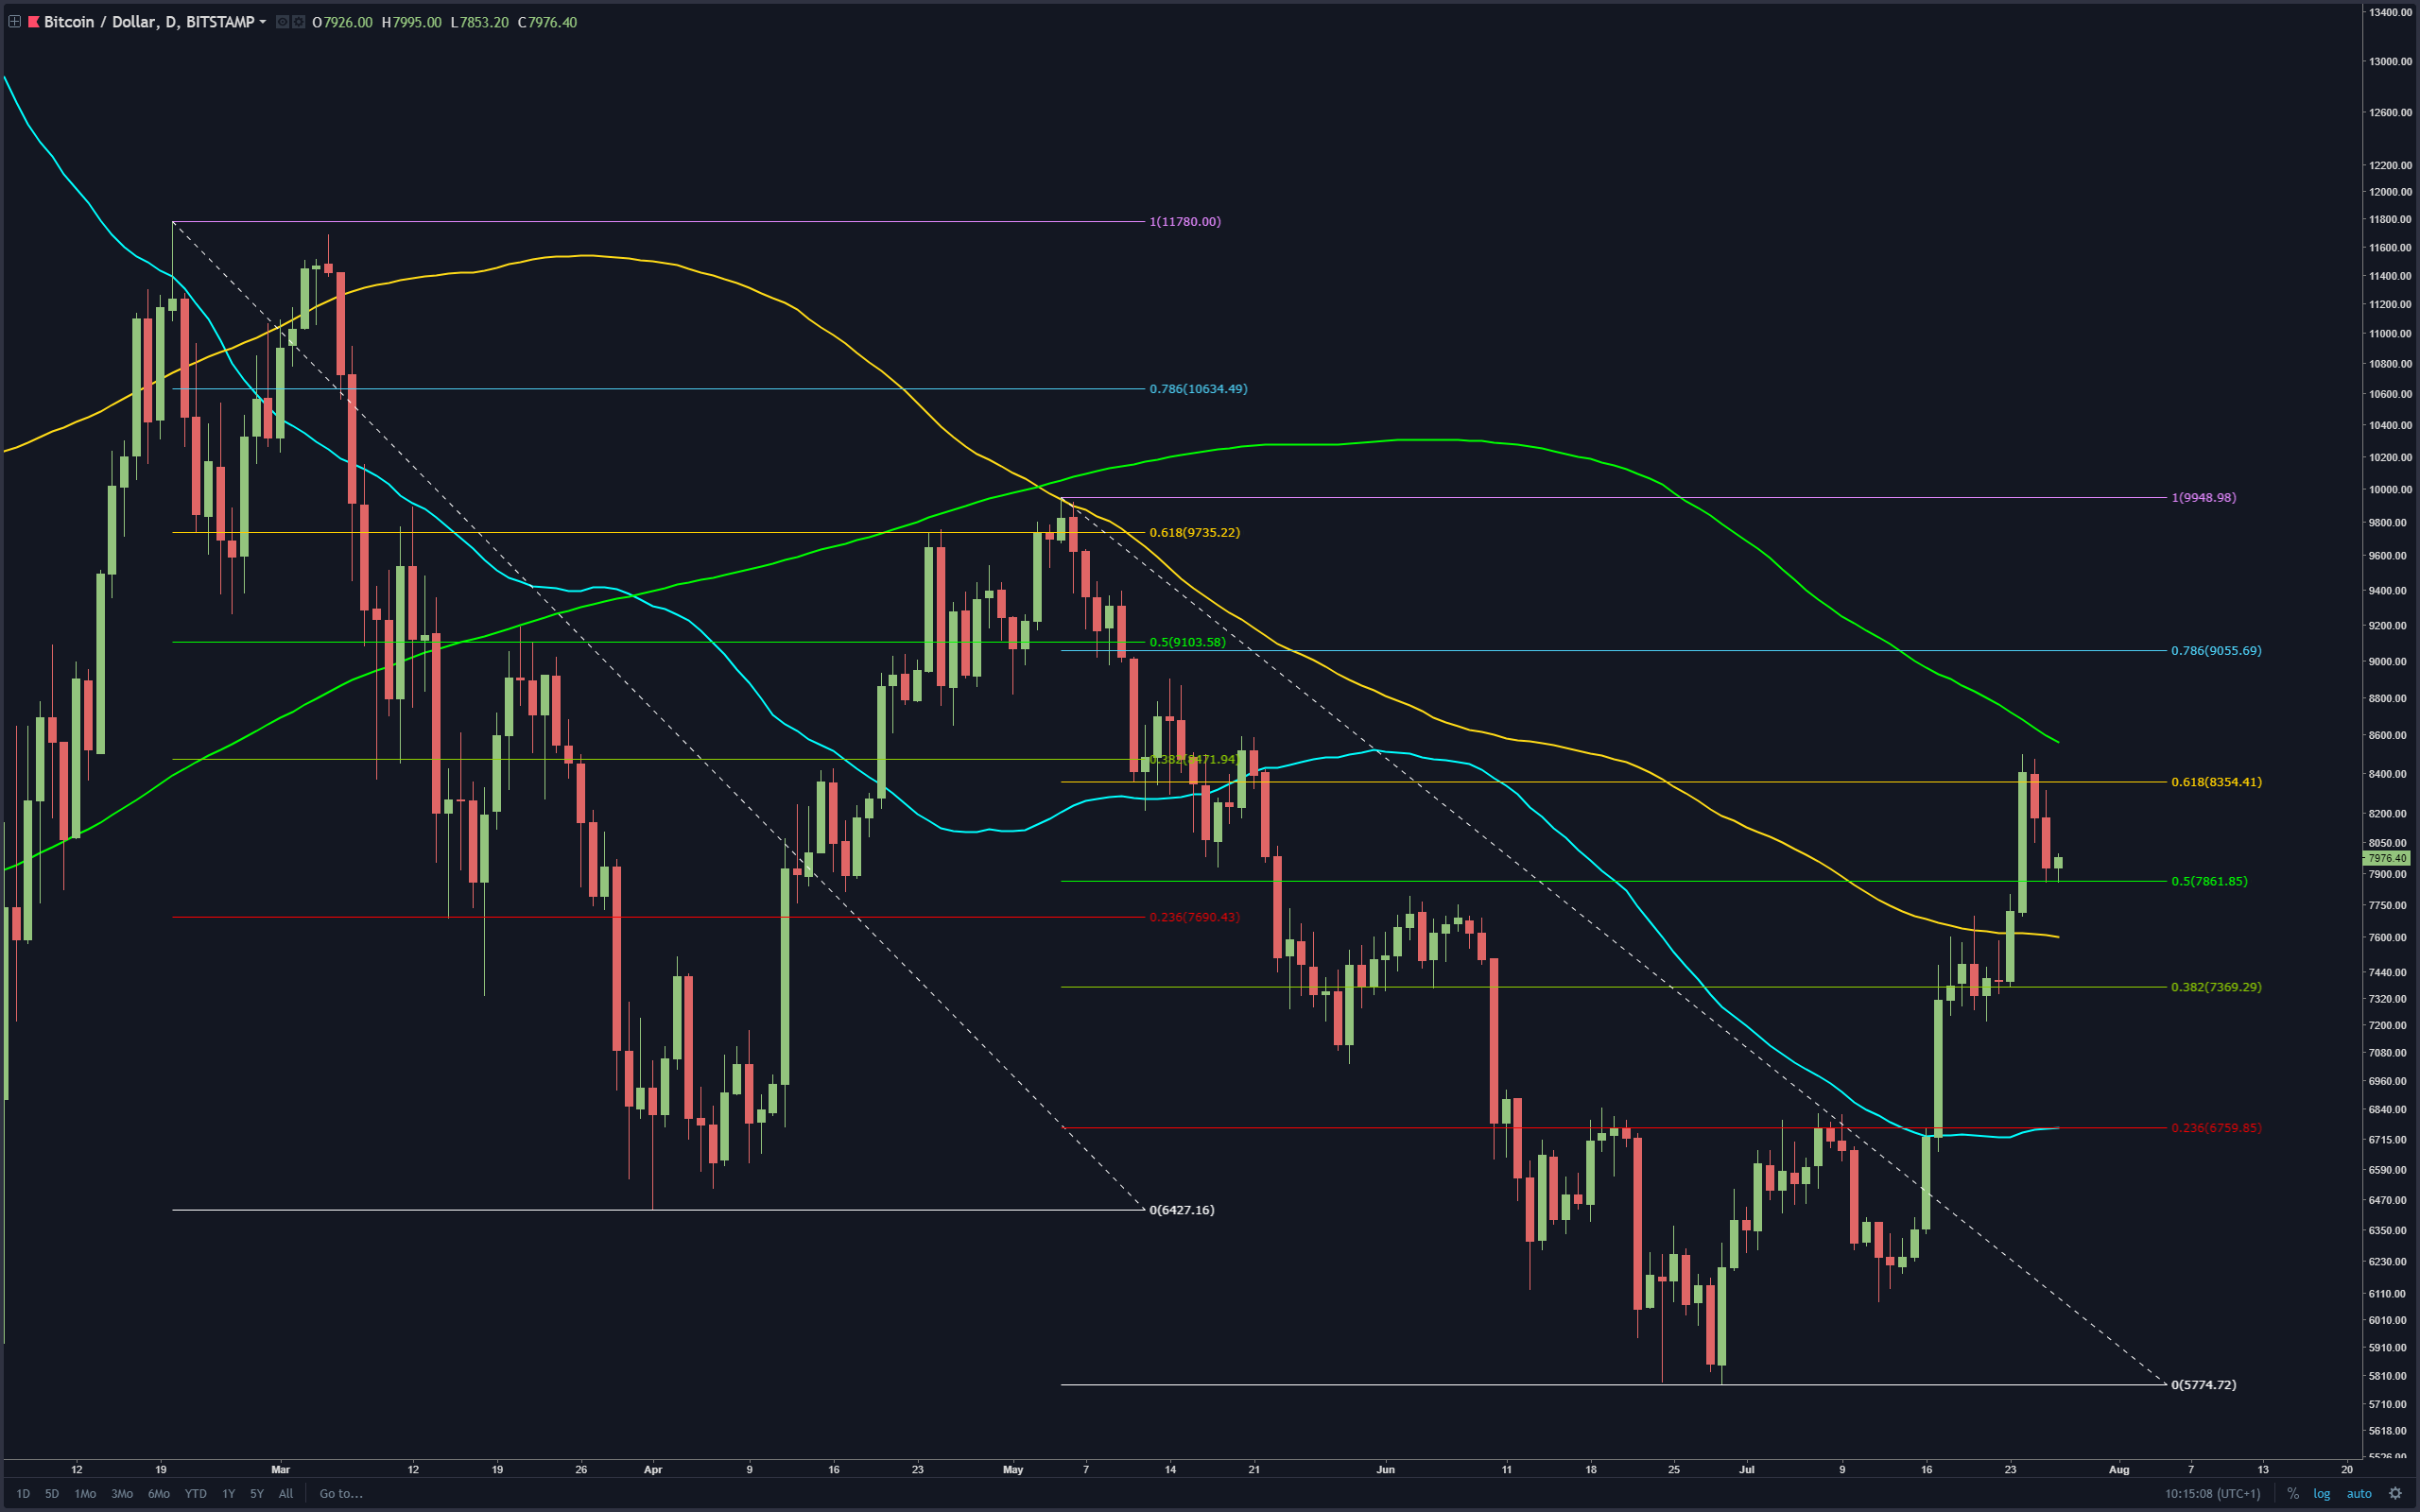
So far this recent bounce we're in since the end of June looks very much like the previous one from the 5th of May and in both cases price has bounced of 200-day moving average reaching just slightly over Fibonacci's Golden Ratio 0.618 level. In my opinion, I think that just like on the previous two occasions, we're going to drop back down from it and this time we're going to break through the $6,000 level hard only to stop somewhere around $4,200 but before that I think we'll stop on Tone's $4,975 for some time.
~ PREVIOUS ENTRIES ~
Tone Vays [27 July 2018]
On the WEEKLY time scale his current view is NEUTRAL. We've pulled back down a little bit on the SEC news about the EFT's. Weekly chart it still is a bounce into the Death Cross and until it can clear that and then clear the prior high from April, Tone is still sceptical about this entire rally. However those that were trading the sequential and saw the 9 on the week ending on the 15th of July, could have at least play the 1 to 4 candle correction. Tone didn't play it because it was too risky and he didn't like the risk to reward ratio so he stayed with his overall bearish trend on the weekly chart. source
On a DAILY time scale we've topped on a "9" in his sequential system and this wasn't a reversal candle so we could have a 1 to 4 candle correction down, then we could move back up to the recent top but it's close to the 200-day moving average, which is trending down. If on Monday we break above $8,400 and then above the 200-day moving average that may be an opportunity for a bullish swing trade but it may be short lived because on a weekly time scale we're gonna get a Death Cross at around $8,700 level. So even though the daily chart is turning BULLISH, weekly chart is gonna run into some major resistance. source
Tyler Jenks [26 July 2018]
If Bitcoin went above Tylers two important levels at $10,100 and then $11,100, he would at that point become intermediate or even long term BULLISH. source Until that happens his Hyperwave analysis says that nothing has changed and all the bounces we've had so far have lower highs and lower lows, so he thinks we're ready for the next move down, that will take us to at least $5,100 or Tone's $4,975 levels which is the Phase 2 line and we're going to touch it 4 or 5 times and we'll probably break down through it only to come back and close above it. If it holds, we'll get a massive bull market but his Hyperwave theory states that there is only about 25% chances that it will hold and if it doesn't, we'll go all the way down to Phase 1 level at a $1,000 because there's no other support to stop it. source But more presently we're coming up on a Death Cross within next weeks but it won't change the Hyperwave targets because it has formed itself long before the Death Cross, besides we had a few Golden Crosses embedded within the original Hyperwave too. Phase lines are telling us where the bottom is going to be and the only one left is the Phase 2 line which will get tested few times before we'll know if it holds. source
SAR is a [POSITIVE] showing us a second positive day of this week. source.
Bollinger Bands are a [NEUTRAL to POSITIVE] We've broken above the middle line of the BB and we need to close above it but right now we still have 3 days to go. source.
Moving Averages are a [NEGATIVE] because the long term 30-week MA is no longer moving up and is heading for a Death Cross with short term MA. 30-week MA is a very strong resistance that first needs to be overcame to get to the bull market and he doesn't see it at the moment. source
RSI is a [NEGATIVE] it's moving upwards now but he believes is very bearish because now we have to drop down from 50 all the way down to 30 to become oversold. source
MACD is still [NEGATIVE] we're nearing the crossover and after that maybe we'll get two positive histogram bars. source
Tyler believes the earlies we'll see the EFTs will be around April next year and there be a pop in the price. If we lost another ~500 of these other cryptocurrencies this pop will be substantial, if we hadn't it will take more than the announcement of the ETF's to move the price up substantially. So we need to clear out the undergrowth and then we're ready for the bull market. source
Alessio Rastani [22 July 2018]
Since the 29th of June when the rally started Alessio is quite BULLISH, he believes that Bitcoin has finally BOTTOMED OUT and as long as it remains above the $6000 level it will remain bullish. In June it came down to the 21-months moving average by far one of the most important levels of support in Technical Analysis and managed to bounce of it. On a daily time scale we've experienced a False Breakout, Bitcoin came back down to the previous support level from the 2nd of February and then went below it for a short time only to immediately come back above it. FALSE BREAKOUT of a support level is a very bullish signal. According to the recent Commitment of Traders report from the 17th of July 2018 there were 4135 Shorts in contrast to only 2495 Long positions held by the "Dumb Money". That means that the majority of the Bitcoin traders out there have still been bearish, therefore this is a bullish CONTRARIAN signal. His bullish outlook is additionally supported by an inverted Head and Shoulders reversal pattern on a daily time scale.
Against his bullish outlook stand 100-days and 200-days moving average resistance levels, previous heights at $10,000 and $11,000 to $12,000 levels. If Bitcoin falls below $6,800 level, this would be a huge warning sign that something is wrong, if it falls down even lower to $6,000 levels, it would mean that Bitcoin has 75% to 80% probability of dropping much lower to $5,000 or even $3,000 levels. source
You are following good traders and analysts! Check out my work if you are interested.
Bitcoin (BTC/USD) Elliott Wave Analysis - Uptrend Continuation or a Lower Low? (Target 3000$)
https://steemit.com/bitcoin/@drumsta/bitcoin-btc-usd-elliot-wave-detailed-analysis-uptrend-continuation-or-a-lower-low
I agree with your analysis, guy I follow Prezes, he's been talking about this retracement to previous high from the 2013 since basically even before the last bubble burst.
If indeed price goes above your $12,000 it's going to be a difficult one and it'll will trick a lot of people into a trap. At the moment I'm more bearish and I can't see the price going that high, BTC is so weak and also these recent altcoin price gain "detachment" from bitcoin is quite interesting.
I don't believe that Bitcoin will make it to 12k. I believe that this was it, and from here the price is heading further down. My alternative count scenario is just as I said to spread awareness that even if BTC recovers to the familiar bull levels, we are not out of the woods. Thank you for reading my post, highly appreciated :)
I know. It's a possible scenario and as they say anything is possible. Until 2 months ago I didn't subscribe to these lows but now I even take Tyler's $1,000 much seriously.
This line from BitMEX letter is so true:
"…Nothing goes up or down in a straight line. I still haven’t seen enough pain and anguish to believe we are done bloodletting. In true Bitcoin fashion, the price will go to the level no one thinks is possible and rebound faster than traders can work up the nerve to BTFD…" source
Totaly agree with what was said.