Bitcoin TA - summary of analysts - 26. July 18
Regular daily update on BTC ta analysts opinions.

My summary - short-term (next 24h) sentiment: bullish (last: bullish)

We started consolidating below 0.5 retracement towards 8'200.
RSI on all timeframes up to daily is at overbought level.
We closed over 7'664 (MA128 daily, November 2017 top) - strong signal and also are above bollinger band mid-line.
Major resistances 8'280 (MA50 weekly) and 8'780 (MA 30 weekly).
It seems in the war of the bears and bulls we are entering another battle: Can the bulls create enough FOMO to create distance to the lows and overcome major resistance levels? If so we are not going to see the current levels for a long time.
Or do the bears lead the bulls into a trap and than smashing hard to the downside. That would create a lot of frustration and might lead to the capitulation which you would expect to be necessary to call the bear market over.
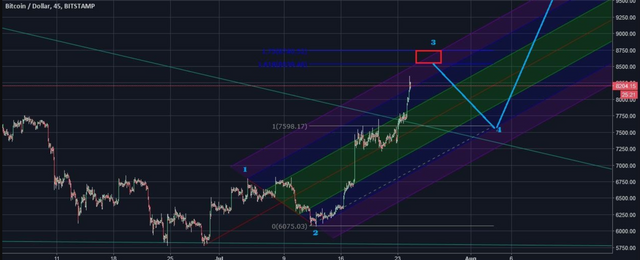
Bull scenario*:
- After completing 5 waves up we reconfirm 7'000+ level in a ABC pull back gathering strength for another move up.
- That confirms a higher low and bullish 5 wave count.
- Alternate: Bull flag is forming - that brings us directly to next resistance level at 8'300 from here.
- Volume needs to increase.
- We overcome the death cross area of the 30/50 week MA and break above it.
Bearish scenario*:
- We move up for one or two weeks into the death cross (30 and 50 MA weekly) at around 8'500 and than drop significantly.
- Alternate - bears are turning after the RSI gets oversold and make a lower low
- After breaking 5'800 a significant drop towards new lows in the range of 4'975 and 4'300.
*scenarios based on daily-candles - so around 4-14 days timeframe. See also definition section
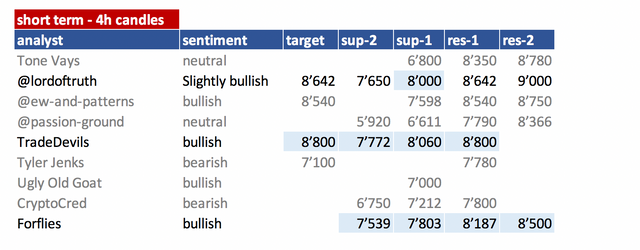
Summary of targets/support/resistance of TAs
Short-term overview
mid- and long-term overview
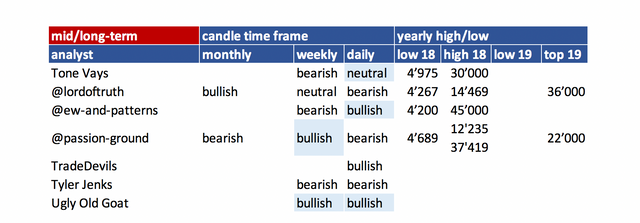
- please refer to definition section for time-horizon.
- be aware that mid- and long-term is mostly my interpretation of what analysts sentiment is as they not always clearly differentiate those time-frames. To interpret that consistently is very hard so please be kind with my interpretation.
- you can easily spot which analyst did an update
(block writing - grey ones don't have an update today).
Their changes are in light blue.
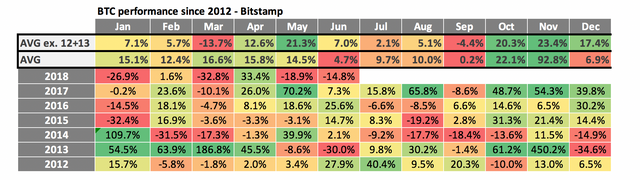
Helpful statistics:
monthly performances
- Added 2012 + 2013 on request.
- As 2012 and 2013 the % move are gigantic I added two averages. One without 2012 + 2013.
- June performance was very weak. With -14.8% clearly below the average of the last years. With 2013 this is the only negative month at all.
- July is a mixed bag - 2 year positive performance and 2 year of negative performance. 2012 and 2013 were positive though.
- The average is positive with 2.1% but that is mainly due to the bull rund 2017. The average incl. 2012and 2013 is even more positive. That is mainly due to the 40%+ spike in 2012 so I wouldn't rely on that.
So just looking at this table we probably facing another negative month.
News about the blog
- I added two analysts
- CryptoCred: Posting target on twitter and has very good educational videos. See Educational links section for them.
- Forflies: I added him not knowing him too well - that is why his logo is in grey box - meaning under evaluation.
Analysts key statements:
Tone (bullish):

Weekly: We got green 2 above green 1. That is a bullish sign. We are close to the death cross. He sees a high probability that we are turned around any moment. Weekly RSI is not higher than 55 a resistance line.
Daily: We are on a 9 - watch out for pull back.
Still short term he is bullish but mid-term remains bearish.
@lordoftruth (slightly bullish):
Bitcoin price fluctuates above 8'000 barrier, trying to resume the
main bullish trend ( The trend is slighty bullish as long as the price above 7'650 ) supported by Stochastic Positivity.
But the price appears to be faced some bearish pressure ( As we expected in our previous post ) before the Major Resistance at 8'642 and might be forced to retreat from the climb, to test 7.650K before the moving ( In absence of another set of positive developments to sustain the climb ) towards 38.2% FIB level near 7.050K, supported by RSI Negativity.
Todays trend is Slighty Bullish. Trading between 7'650 and 8'280.
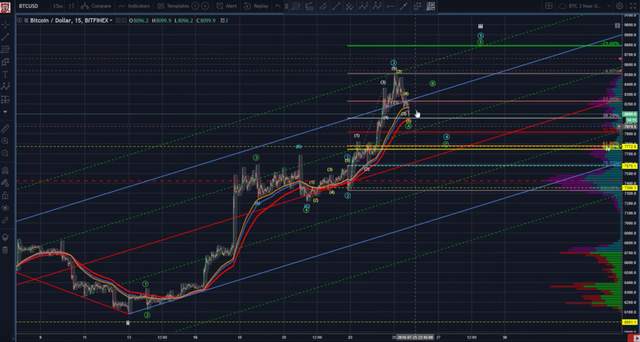
@ew-and-patterns (bullish):
I suspect this to still be part of blue wave 3. 162% or a little overshooting of 8540 would be the perfect target for blue wave 3.
After this wave 3, I expect a bigger correction lasting a few days until the beginning of August. 7500 - 7400 would be a reasonable target for blue wave 4.
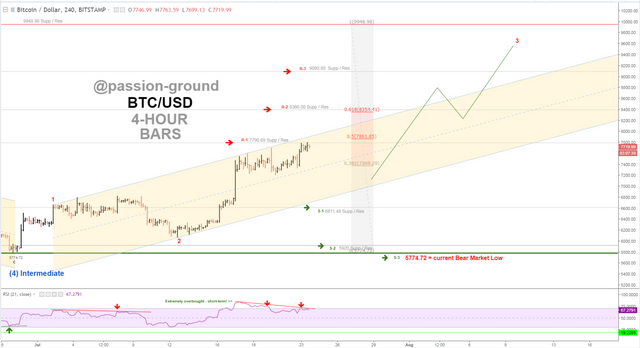
@passion-ground (neutral):
The above song is from a 1977 Isley Brothers album entitled, “Go for Your Guns.” Although most hodlers “went for their guns” a long time ago, the price of BTC is climbing, - it keeps pushin’ - and we’re bound to know. (If the recent low is going to hold or not – that is.) Though the ladder remains shaky, it still remains up that we gotta go! "Ain't nuthin' wrong, babe, in believin' in a dream!"
We were extremely overbought. RSI is showing divergence against those highs (4hours). That tells him we need to pull back some time. If we do so he would like to see that the uptrend channel holds.
TradeDevils (bullish):
He expect us to go up another leg.
The current retracement will go to 7'772 area at 0.382.
Than going up to wave 5 at -0.236 at 8'800.
That would confirm the bullish count and trend change as it is necessary to go above the 0.5 retracement of the whole move to reduce likelihood of bearish scenarios.
UglyOldGoat (bullish):
No news on market but he has written an interesting educational article.
check it out
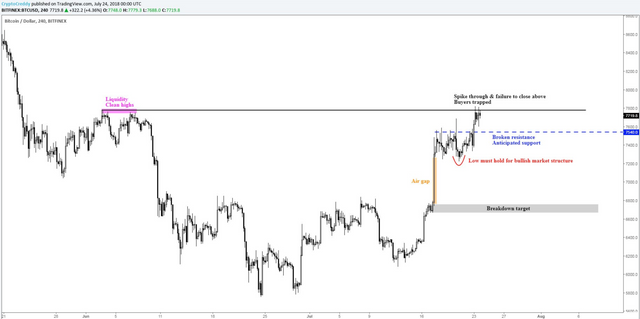
Crypto Cred (bullish):
Price reached yesterday's target — what now?
I'm favouring a retracement.
I) Price spiked into liquidity & closed below - buyers trapped
II) Untested S/R level at 7540s
III) Red low must hold to maintain overall bullish structure
Wrong if close through 7.8k.
Froflies (bullish):
What means last pull back?
We still might be in a bull trap.
But we are making higher lows and higher highs.
Looking at the degree we are not in a sustainable uptrend. So we are looking for a pull back at some time.
8'500 rejected us and we are going down since than.
Very small movements to the downside are turned into crash scenarios easily - he is believing that is not true.
He assumes that sellers are exhausted and now we go up.
Pattern looks like a falling wedge which is a continuation pattern. That needs to be confirmed by decreasing volume.
Volume is not good at the moment - dropped to 17 b total.
The higher we go we need to see higher volume which it is not doing at the moment.
Reference table
| analyst | latest content date | link to content for details |
|---|---|---|
| Tone Vays | 24. July | here |
| @lordoftruth | 26. July | here |
| @ew-and-patterns | 20. July | here |
| @passion-ground | 23. July | here |
| @tradedevil | 25. July | here |
| Tyler Jenks | 18. July | here |
| UglyOldGoat | 24. July | here |
| CryptoCred | 22. July | here |
| Forflies | 25. July | here |
Definition
- light blue highlighted = all content that changed since last update.
- sentiment = how in general the analysts see the current situation (bearish = lower prices more likely / bullish = higher prices more likely). The sentiment is based on 4hr, daily, weekly, monthly candle charts.
- The forecast time horizon of candles can be compared with approx. 4hr = 1-2 days; daily = 4-14 days; weekly = 4 - 14 weeks; monthly = 4 - 14 month.
- target = the next (short term) price target an analysts mentions. This might be next day or in a few days. It might be that an analyst is bullish but sees a short term pull-back so giving nevertheless a lower (short term) target.
- support/res(istance) = Most significant support or resistances mentioned by the analysts. If those are breached a significant move to the upside or downside is expected.
Educational links:
- From @ToneVays: Learning trading
- From @lordoftruth: Fibonacci Retracement
- From UglyOldGoat: How to achieve the same results of a professional trader without taking the inherent risks
- From CrytptoCred: Several great educational videos - very structured and helpful
- From @haejin: Elliott Wave Counting Tutorial
*If you like me to add other analysts or add information please let me know in the comments.
Wow what a great recap of a bunch of different sources' opinions! Any chance we could get added? ;)
Bullish!
@famunger, I would like to know your opinion on Steem, thanks.
Yes i would also like to see that
good post this post article best
I have upvote you in your post please doo the same for me