BITCOIN Moving Average Analysis
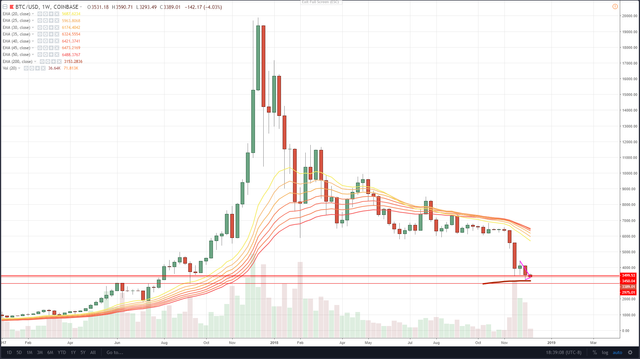
Had a request to look at the EMA levels here, so figured it'd be a good time to go over them. The EMA in question is the 200 EMA on the weekly chart.
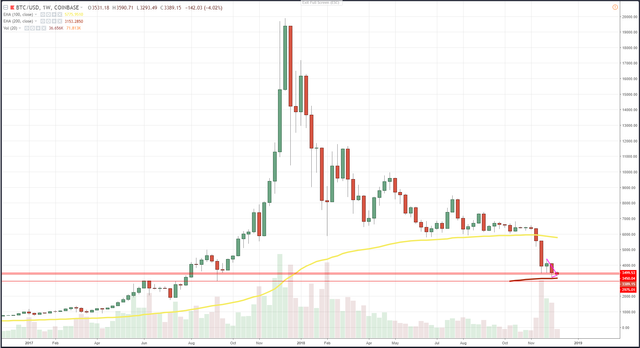
The yellow line represents the 100-day EMA, while the dark red represents the 200. As you can see, we broke the 100-day on consolidation, thus losing support and shifting resistance to this level, along with losing the path of least resistance to the upside.
For now, the 200 on the weekly has correlated with this $3,000 support level which we figured would be tested. Weekly RSI is oversold, so these levels will probably have some relevance for a little bit. Personally, I don't expect longer term prices to hold up here.
A look at the daily EMA's would show that there's a lot of resistance and unwillingness of the bulls to overcome the 12 EMA. As such, This major down trend will continue after a period of consolidation.

Thanks for posting , solid info , much appreciated
thanks! enjoy./
Interesting. Thanks for looking into this and sharing your thoughts.
cheers!