Looking at the BTC/EUR 1 year chart
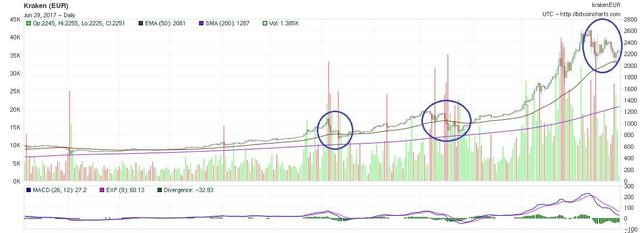
Bitcoin just recovered from a correction. Since these event tends to scare people off I though it would be beneficial to take some distance, so I had a look at the 1 year BTC/EUR chart. You will notice that the pair has been in several such corrections during the last year, one in January and one in March. In both cases after a significant fall Bitcoin always recovered to an higher value.
I also plotted the 50 days exponential moving average (in brown) and you will notice that in the case of both those correction the price went under for at least a week, which we have not yet experienced this time, so there is a risk of one more down leg to this correction. When looking at the 200 days simple moving average (in purple) we see a clear uptrend that has never been breached in the last year, but the price is currently very far from the average which mean we may have a cooling down period at some point to let it catch up.
Overall the long term trend is still up, but we may need a bit of patience.