3 charts to ponder
I am not certain which of these charts will shake out, but I am fairly certain it will be one of these 3.
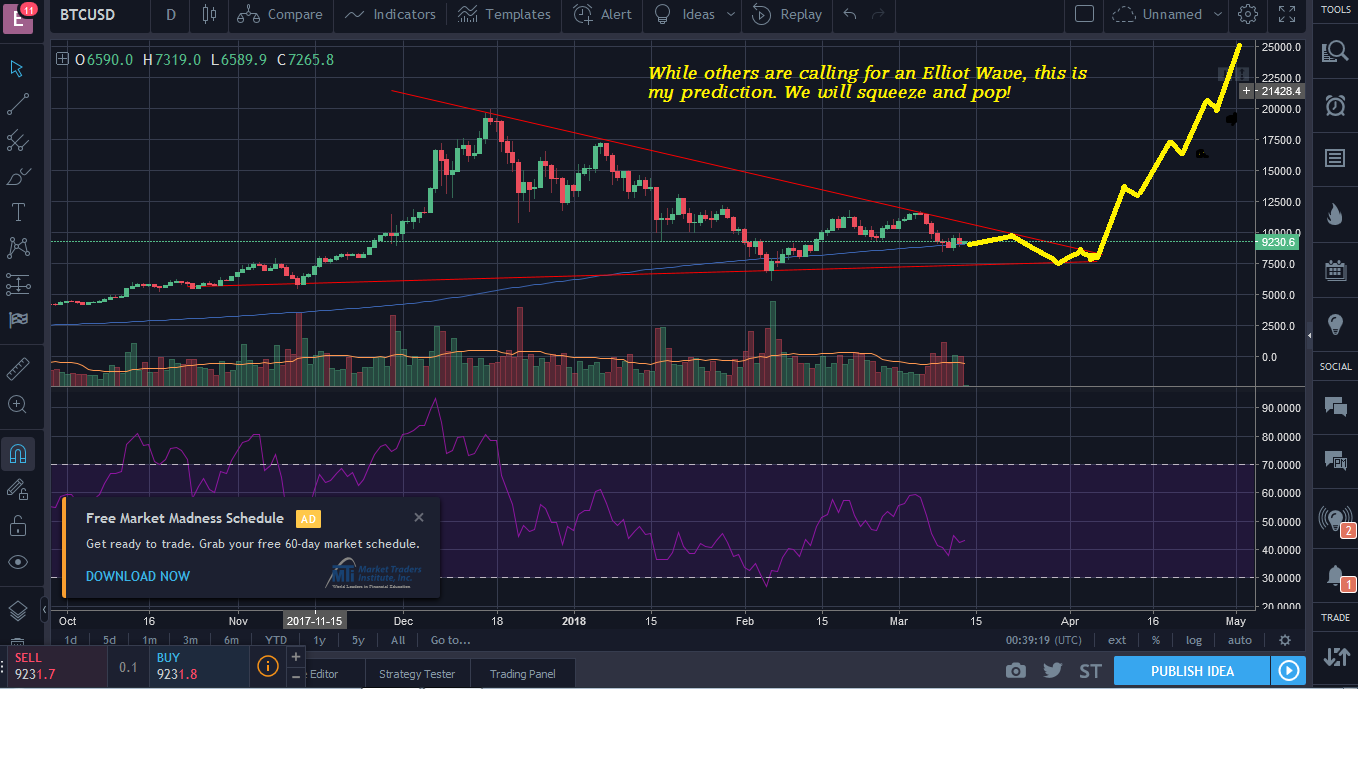
Now excluding the price action until BTC Futures contract ends on Wednesday (2 days from now), here is how I see Bitcoin price action. The below is my personal opinion.

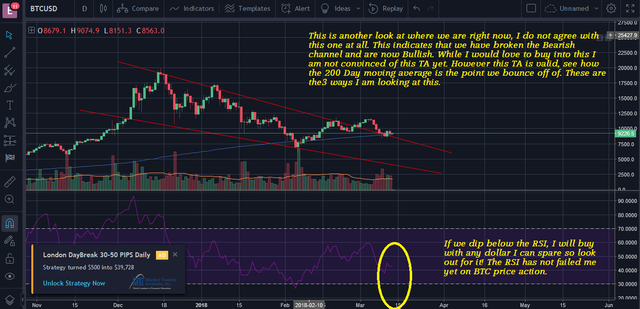
The next chart is from my previous prediction, however I no longer believe in the former but am betting on the latter. This Chart has its merits, and it very well may be spot on, but if this is the case we are in for a very drawn out rise in my opinion. This does not signal a Bull Run, rather more sideways trading and rising just enough to stay over the 200 day moving average (the blue line). I really hope this is not the case, not because I am concerned about Bitcoin or Block Chain, but because I am inpatient and want to pay off my mortgage.

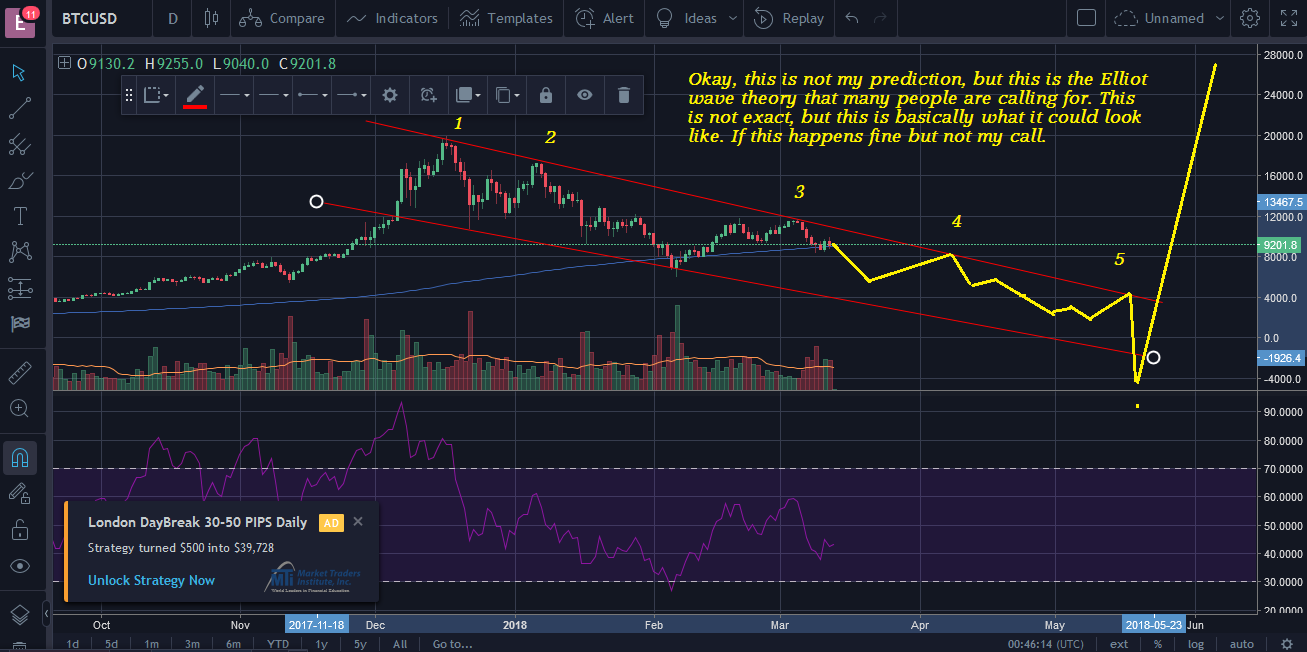
Now the last chart I have been pondering that I do not see happening is the Elliot wave. Now while I would not mind if this happens, the reason I do no think it is possible is due to buy volume on the previous dip. If you remember back in February when we hit the dip after the last ATH, we say a Yuge Spike in buy volume. So with Buy volume at those proportions during a dip to 7K I can not imagine us ever getting anywhere near $4,000 dollars let alone $3,600. So I can not see this ever coming to fruition, but in the worst case scenario (in my mind), this is what it could look like (and even worst case has a silver lining, just more delayed.
