The MACD Indicator
Another useful indicator to monitor the movement of Bitcoin (which can be found on Trading View is the Moving Average Convergence/Divergence oscillator. In brief it tracks two moving averages and computes the difference.
Imagine that you have a series of numbers 1,2,3,4,5,6
A moving average of 3 digits
(1+2+3)/3 = 2
(2+3+4)/3 =3
(3+4+5)/3 = 4
(4+5+6)/3= 5
A moving average of 4 digits
(1+2+3+4)/4 = 2.5
(2+3+4+5)/4 = 3.5
(3+4+5+6)/4= 4.5
(4+5+6+7)/4 =5.5
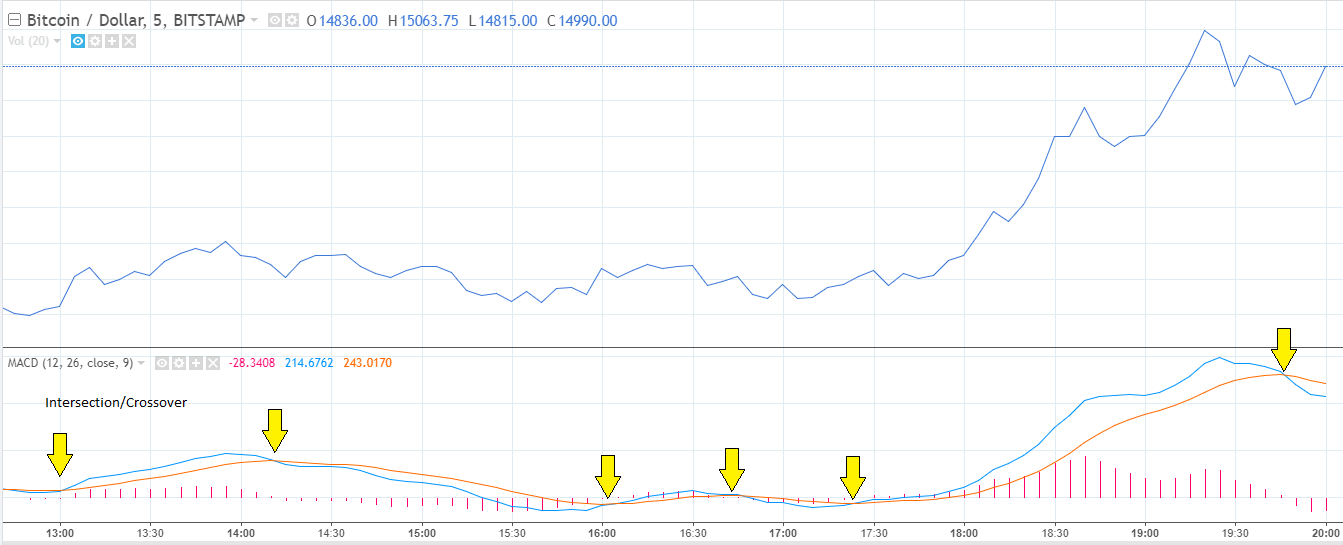
Since I used a sequence which would continue in straight lines upwards there is always a .5 differences between these two moving averages. If the series fluctuate the moving averages tend to intersect. As you can see in the graph above, these lines can cross many times in a day depending upon the values you have set for the moving averages comparison. While I am not interested in day trading, you can see by comparing the intersections on the MACD with the rise and fall of the price chart, it could be used as a trading signal to buy and sell.
If you find this of any interest, I would appreciate if you could upvote and resteem this post.