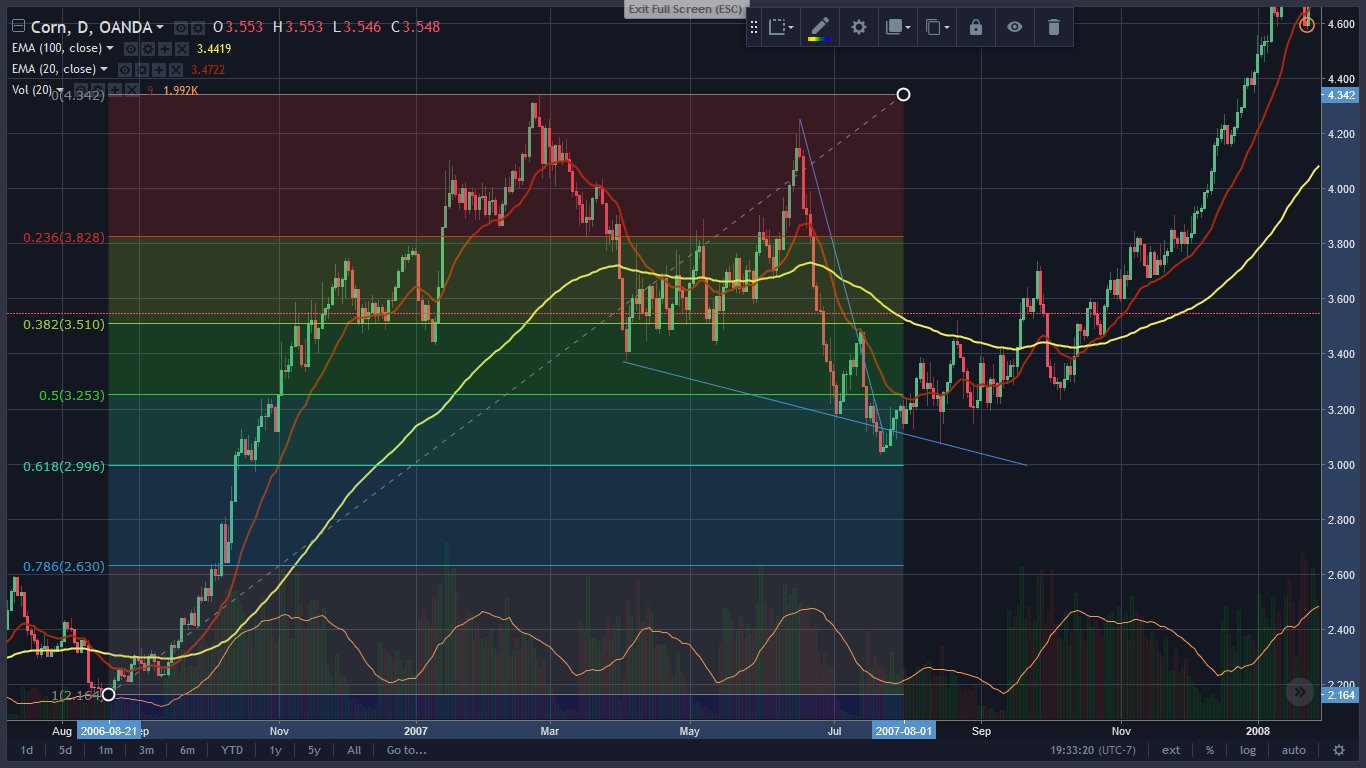
I've made an interesting observation of the price action of corn from 2006 and 2007. What's interesting about the chart is that it's so uncanny how it looks like BTC. Notice the A,B,C,D,E, wedge correction just like BTC's. It's important to note that the CME is active in both these trades now. Check out this chart...