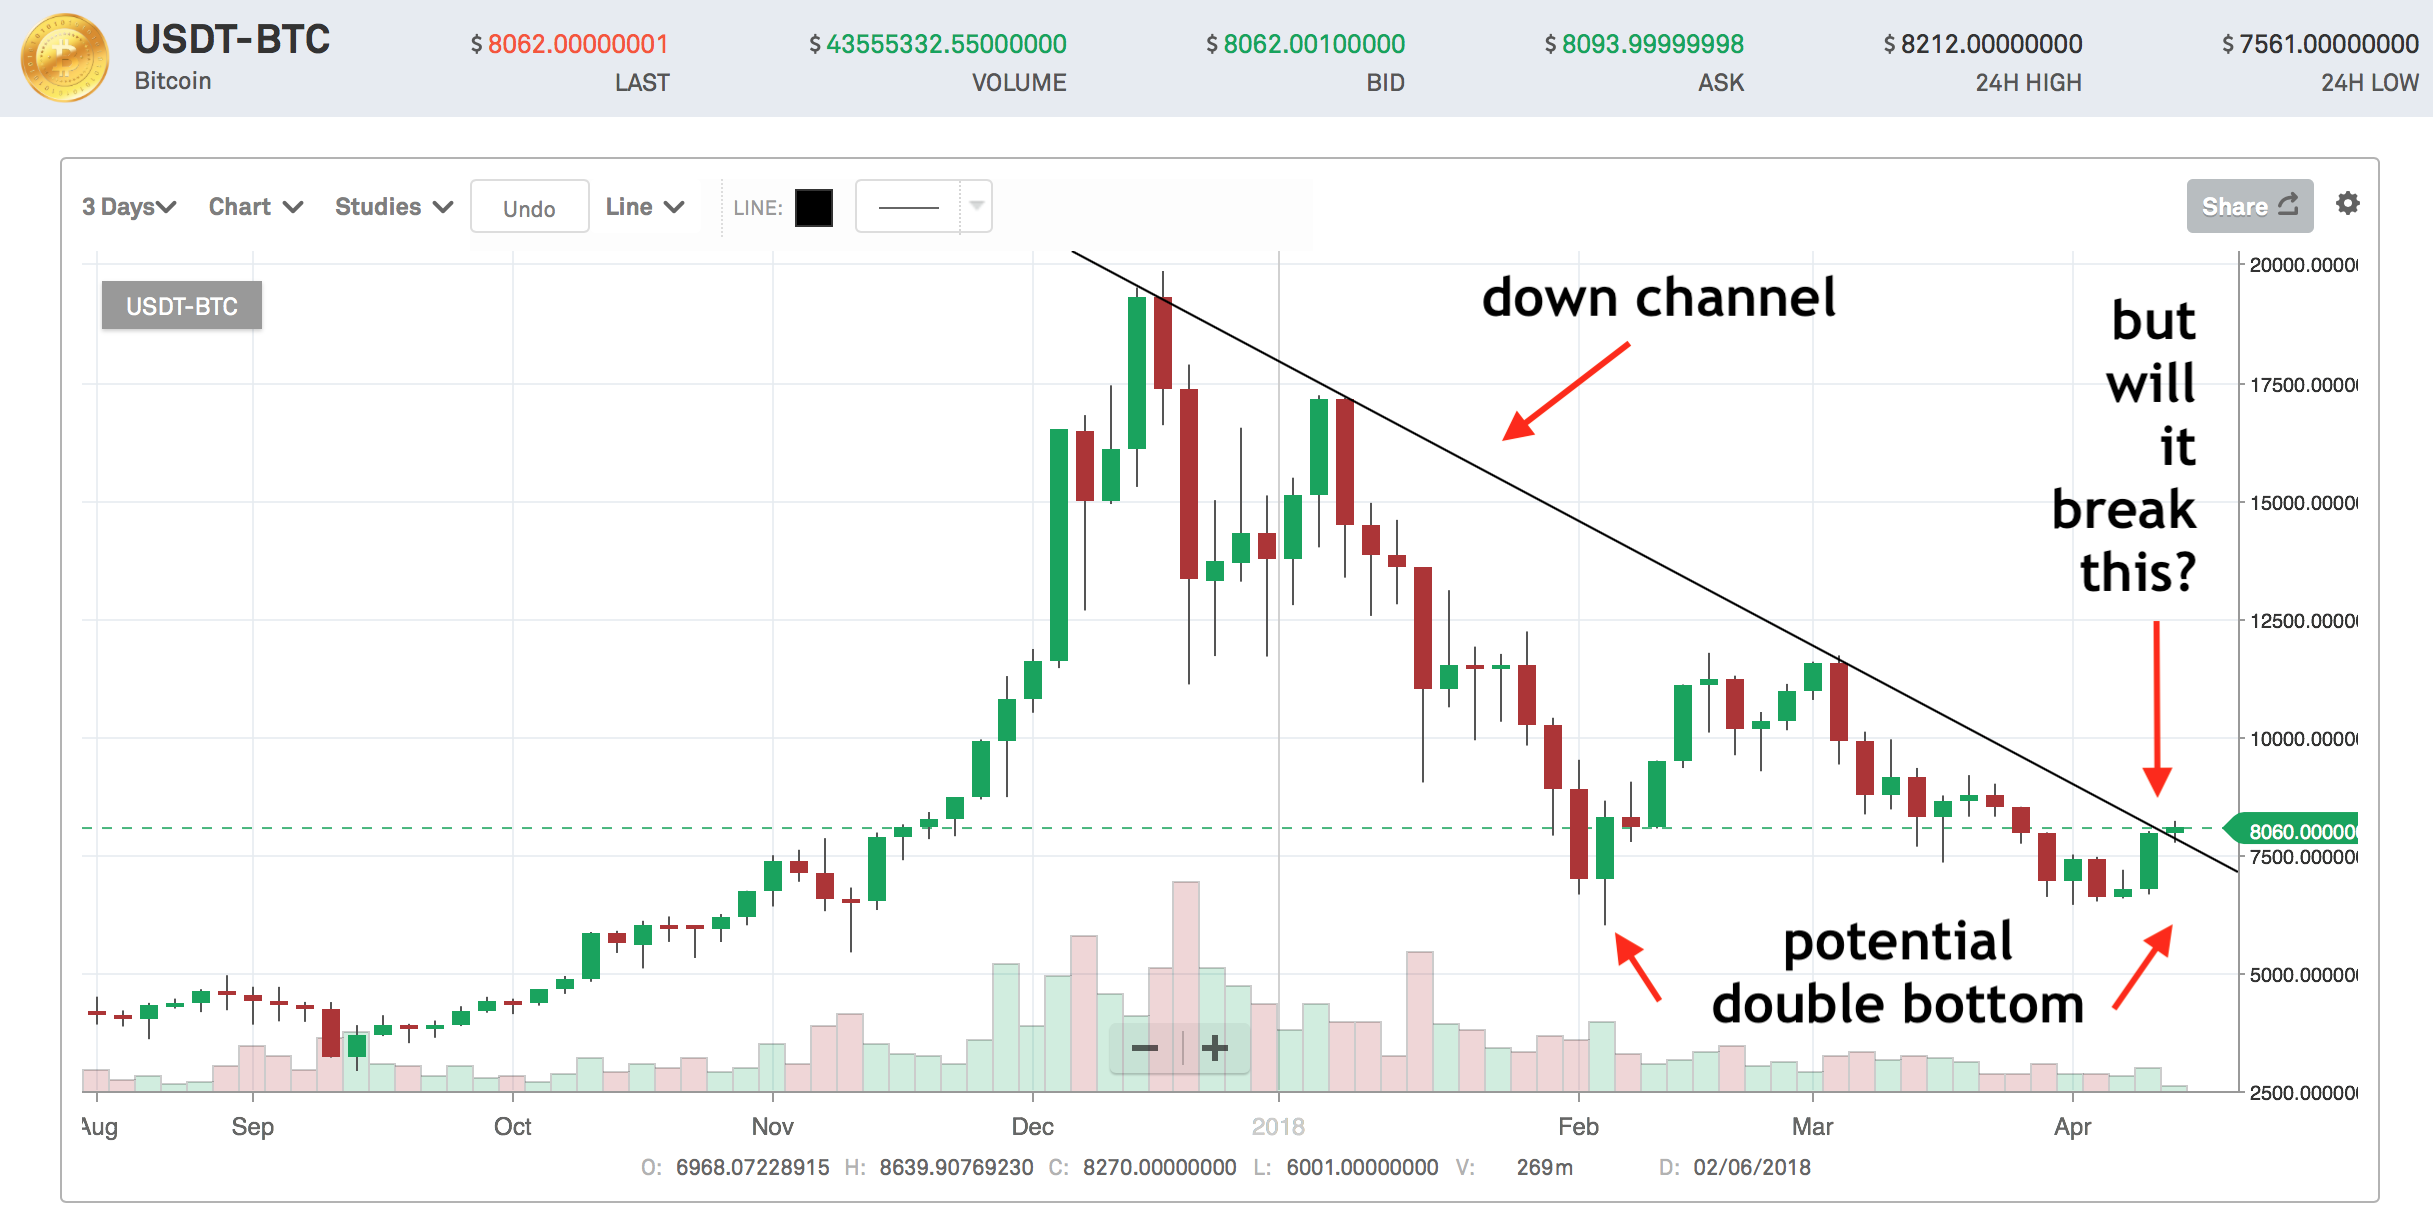
This Weekend Question: Will Bitcoin Break Up From The Down Channel?
I don't usually draw lines on Bitcoin charts, but, boy, when I draw them, they look like this:
And not only do I draw lines illustrating the down channel in which Bitcoin is for the last 3 months, but I also dare to envision some inflection points.
For instance, if Bitcoin will break up above the line, chances for a real bull run are increasing dramatically.
But if the latest - quite unexpected, and a bit strange, to be honest - bull run will prove to be a bull trap, then the descent will not only continue, but it may also accelerate.
So, grab your popcorn and watch the charts this weekend, because we may be in for a treat: no matter the direction, the price may swing a lot.
I'm a serial entrepreneur, blogger and ultrarunner. You can find me mainly on my blog at Dragos Roua where I write about productivity, business, relationships and running. Here on Steemit you may stay updated by following me @dragosroua.

Wanna know when you're getting paid?

|
I know the feeling. That's why I created steem.supply, an easy to use and accurate tool for calculating your Steemit rewards |

Forget the popcorn, I'm going to get out of the house and stop watching the markets so I can enjoy a weekend for once :-)
Hahahaha. That is probably the best advice at this point. The drama around crypto sure is fun at first, but after a while, especially in a bear market, it just becomes like a very negative dark cloud.
Best comment, so far :)
Haha, you sound like bear market really hit your portfolio :)
I began in late December, so you tell me :-)
This is my third year in the game, I am still learning tho.
I have been taking a crash course for sure. I've been a part of over 50 bounty programs and airdrops so I can learn and get involved without losing everything I own :-), that being said, yes, still down quite a bit.
88% of bounties and airdrop will not materialise.
yes yes yes yes yes yes yes yes yes yes yes yes
If the candlestick is anything to go by, it will break resistance of $8,200.
this is the moment that will describe i guess lets see the market seems to be positive right now :D
@dragosroua, what is interesting is that the down-trend line is a little higher on the log-chart. So bitcoin has not poked out of it :)
Well I guess we just have to wait and see what will happen ;)
I was reading the 4th test of the resistance has historically been the breakout. Havent had time to verify if this is true, but interesting to keep in the back of my mind.
That is a good point with the last pump in prices being a potential trap, so I am going to wait a little bit more before buying anything, because I don't want to FOMO with this one :)
What can be a smart move in this situation? Just relax and watch?
The problem with charts is that you can manipulate them to say exactly what you want. For instance, you are using a 3 day moving average which lines up nicely for the point you are making. How about it you changed it to an hourly or half day moving average, it would look much different. I see your point, but at the same time I think too many analysts read into these charts too much and self fulfilling prophecies become the norm whenever trends are confirmed, and new graph are made when they arent
Take this chart with a bit of salt, it's more about the popcorn as it is about the price :)
haha touche. I know what you're saying though, just playing devils advocate