The Bitcoin WTF Moment Of Today: When Days Are Exact Copies Of Decades
As I was briefly looking at the Bitcoin price today, something clicked. In the beginning I thought I'm on the wrong chart, so I zoomed out. At some point, I zoomed to max, seeing the entire Bitcoin price history and compared with today's chart.
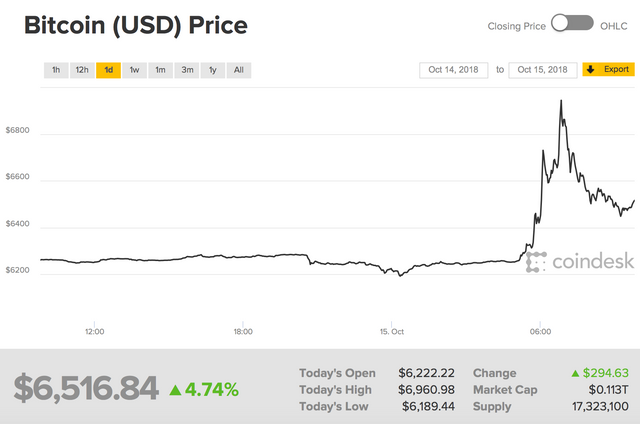
Just see for yourself, this is today's price movement:
And this is the entire Bitcoin price history:
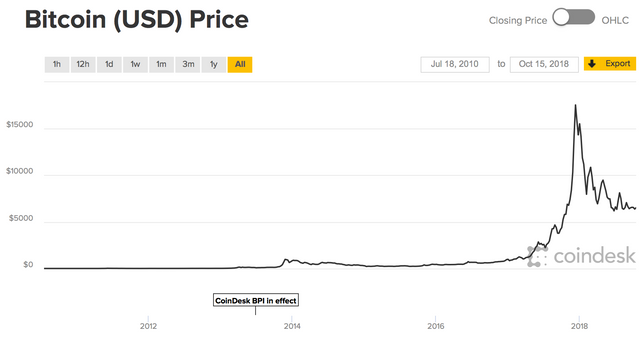
The two charts are almost identical. And this totally unexpected WTF moment takes me way back to my early twenties, when I first learned about fractals.
Never knew back then that I will ever see fractal patterns in the price charts of a virtual asset, collectively own by everybody who uses it, and impossible to control by any government.
Steem on!
I'm a serial entrepreneur, blogger and ultrarunner. You can find me mainly on my blog at Dragos Roua where I write about productivity, business, relationships and running. Here on Steemit you may stay updated by following me @dragosroua.

Wanna know when you're getting paid?

|
I know the feeling. That's why I created steem.supply, an easy to use and accurate tool for calculating your Steemit rewards |
Two days ago I saw this article talking about how researchers are already seeing bitcoin market maturity as fractals are appearing.
Mandelbrot (the guy with the fractals himself) figured out this fractal (what
a surprise!) property back in 2004 when he wrote the (famous?) "The (Mis)Behaviour of Markets"
It's just pattern recognition my friend :-) Our brains are predisposed to see patterns and also to attribute meaning to them even when there is none.
Charts are always going to look similar with each other because they are depicting historical price rises and falls over periods of time.
If they were exactly the same then that would be mildly interesting, though if you look carefully, even though the overall shape is similar, the pattern is different.
Lolz, sorry to rain on your parade! 😁
Cg
I agree with @cryptogee. Nevertheless, this was really a WTF moment :p
Posted using Partiko iOS
I just love those days
Hi @dragosroua Bitcoin hi up Don online currency I socket 20000 USD dollars up Bitcoin to Don 6000 USD dollars y @habib92
Mirror mirror on the wall ... fractals are patterns on bitcoin ... rhymes :-))
Fractals and the Wall Street Cheat Sheet.
Posted using Partiko Android
I've seen a couple of articles this weekend about "killing" bitcoin (and anything relying on proof of work) in order to reduce power consumption. They just don't get it, do they?
OMG!!
The bitcoin prices are truly unpredictable the shorters just got rekt