Bitcoin Technical Analysis: Expect A Further Drop
I haven't done any analysis for a while, during the bull-run everything was going up, so it seemed pointless. In a bull market, I'm not interested in greedy scalping or risky investments.
Now we are again approaching the 70% discount level of $6k, here is a look at the current situation. I'm now starting to ladder my long-term portfollio, I'll only consider day trading again once we return to bullish conditions. This is not financial advise!
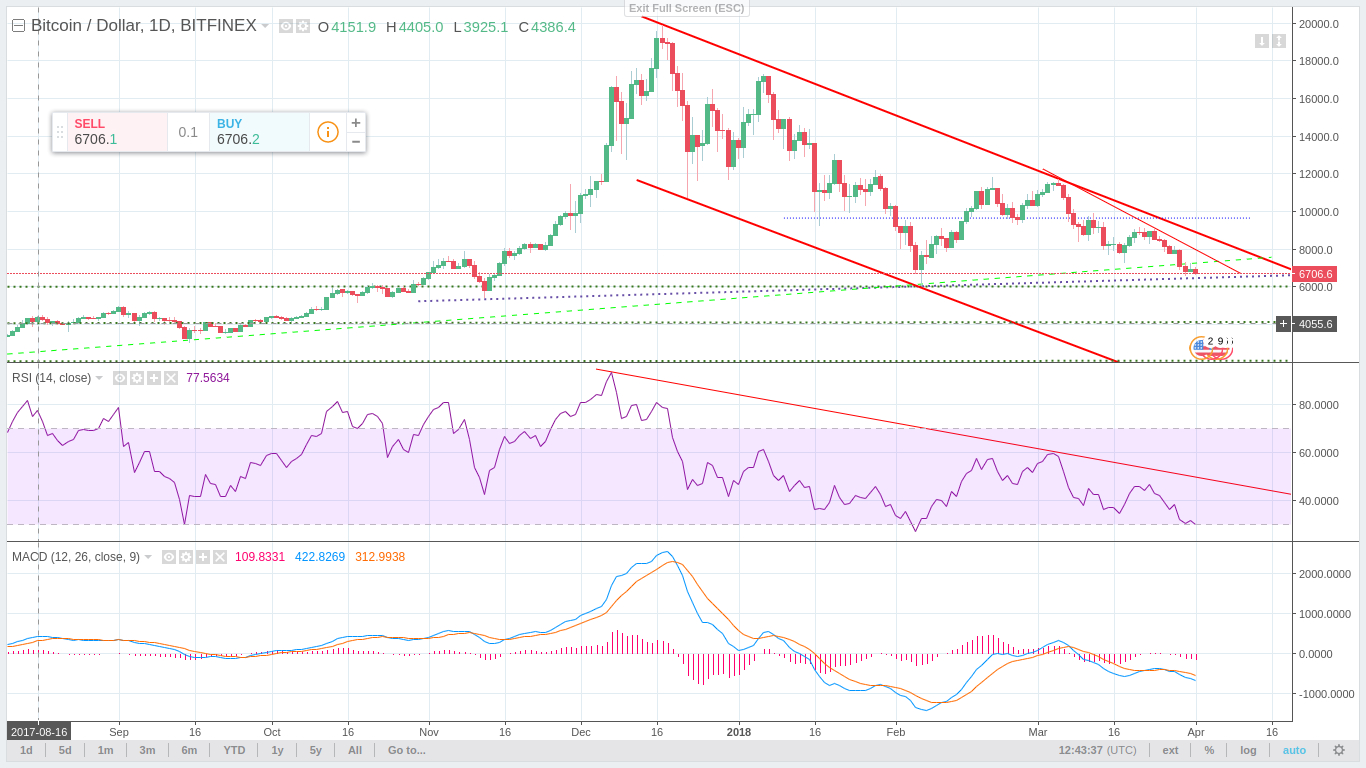
- Green dotted line was the Long-Term Support Trend connecting lows of July, September (2017) and February (2018) that has been breached and turned resistance.
- Purple dotted line is a Short-Term and weaker / less relevant Support Trend connecting lows from November, February and somewhat coincidentally the March 30th low.
- We are now testing the recently established Short-Term Support Trend after reaching the resistance of the old Long-Term Support Trend.
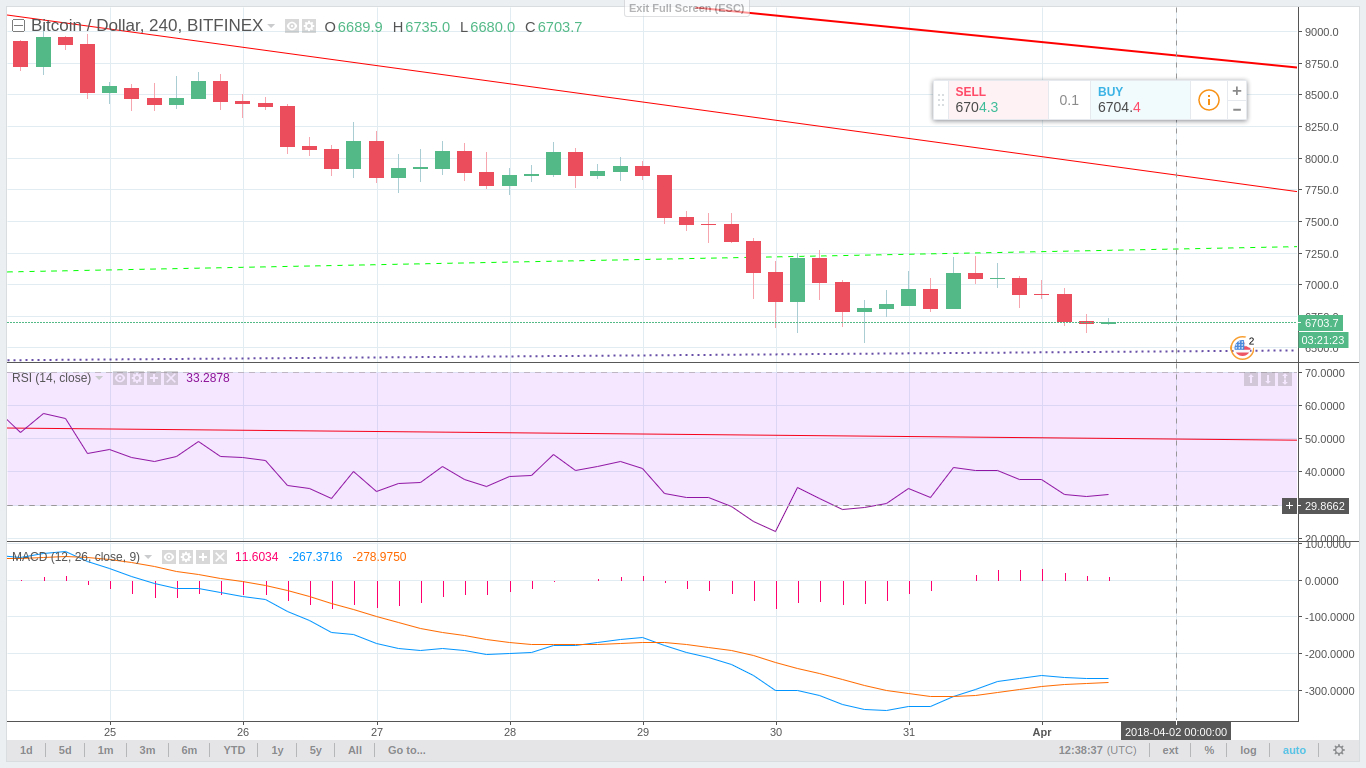
4 Hour Chart (See Day Chart for Yellow & Purple Support Trend):
1 Day Chart (Note RSI is not yet below 30, we are undoubtedly in a downtrend):
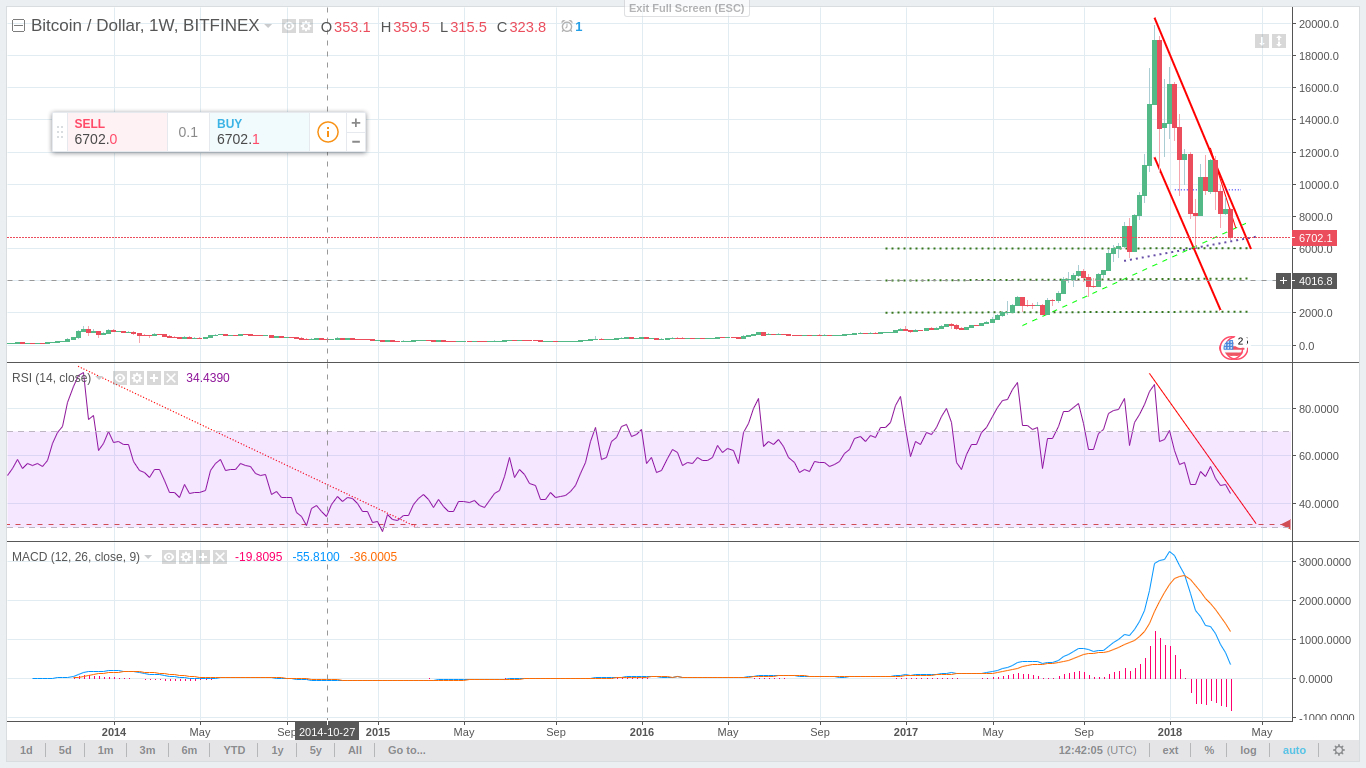
1 Week Chart (Look at the RSI from 2013 in comparison to 2018):
Hi @dragononcrypto
Excellent article. I subscribed to your blog. I will follow your news.
I will be grateful if you subscribe to my blog @user2627
Good luck to you!
That’s pretty clear.
I wonder if there are ways to invest in bc sell options.