BTC Technical Analysis Episode 1 - New Low for BTC??? Bitcoin (BTC) Technical Analysis 21/02/2018
Haven't got the chance the view the BTCUSD chart of lately so here's my technical analysis and I admit at this time it's not looking too good for BTC.
Daily Analysis - 21/02/2018

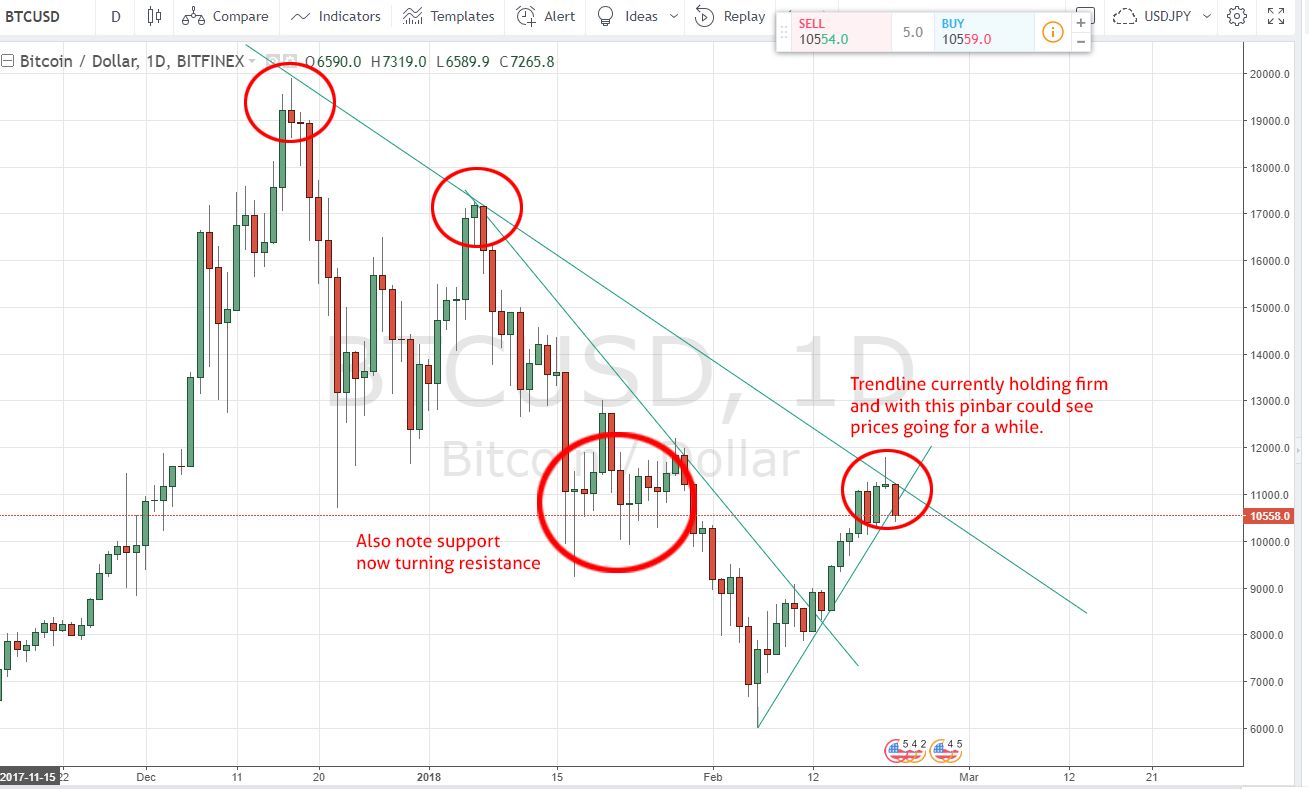
Taking a look at the daily chart we can see that the downward trend line is still intact and proving to be very powerful. The trend line is showing strong support, a pin bar followed with a bearish candle stick at this area could mean serious trouble for BTC.
Not only has it found resistance at the trend line but it is also at previous support area now turning resistance which is another indication that price may drop. Let it be known these are powerful Bearish signals!!!!!!!!
If it does drop we could see it going to at least 8k before another Bullish movement.
4HR Analysis - 21/02/2018

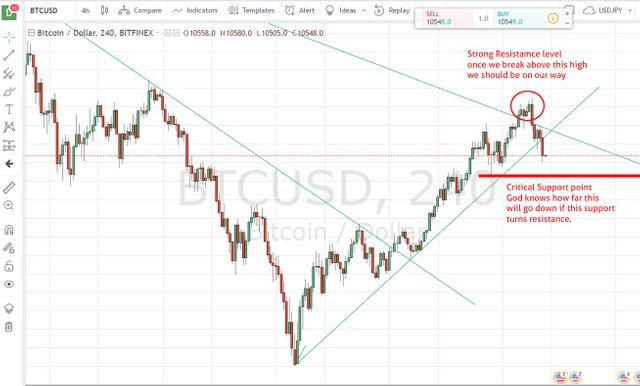
Looking at the Bullish trend line on the 4hr time frame we can see it was breached but there is a Critical Support (Horizontal red line) that still holds and as long as it holds we should be okay until it breaks above the next high. But should it break this support and then this support turns resistance we could see a devastating fall in the price BTC.
Bitcoin price is currently at a very significant area, if it goes above that previous high we are off to the race but if it breaks below the support we could possibly see more downside.
Thanks for viewing
After a massive run up the last few weeks it is to be expected
@decentralization another opportunity to buy at the dip for sure