BTC Technical Analysis Episode 3 - Bitcoin at Critical Resistance level
We have had some movement since my last post and I have made some profits where I bought Bitcoin from about $9500 and exited at about $10400 so lets review and see where the market currently is.
Bitcoin 4HR Chart Review
.png)
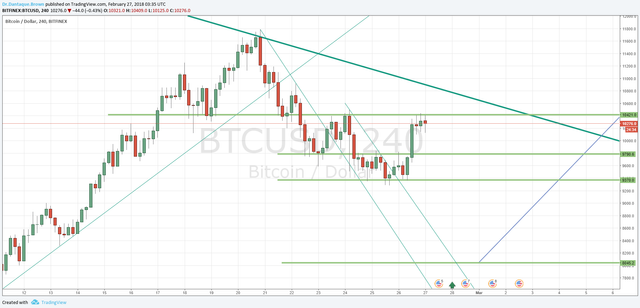
So looking at the 4hr chart you can see that #bitcoin is currently hovering at support now turned resistance. It's possible that the price could form a double top and then head back down to the $9500 range. I am still of the opinion that the lowest the price will go before mooning will be around $8000 and until that happens I will be taking quick buys I will only hold for long if it reaches the $8000 range.
If prices breaks this resistance we could see price touching the MAIN bearish trendline which I'm eagerly waiting to see be broken. If price drops to $9250, we will go down to the $8000 range which is where I would give it all I've got and wait from there for the moon.
Bitcoin Daily Chart Review
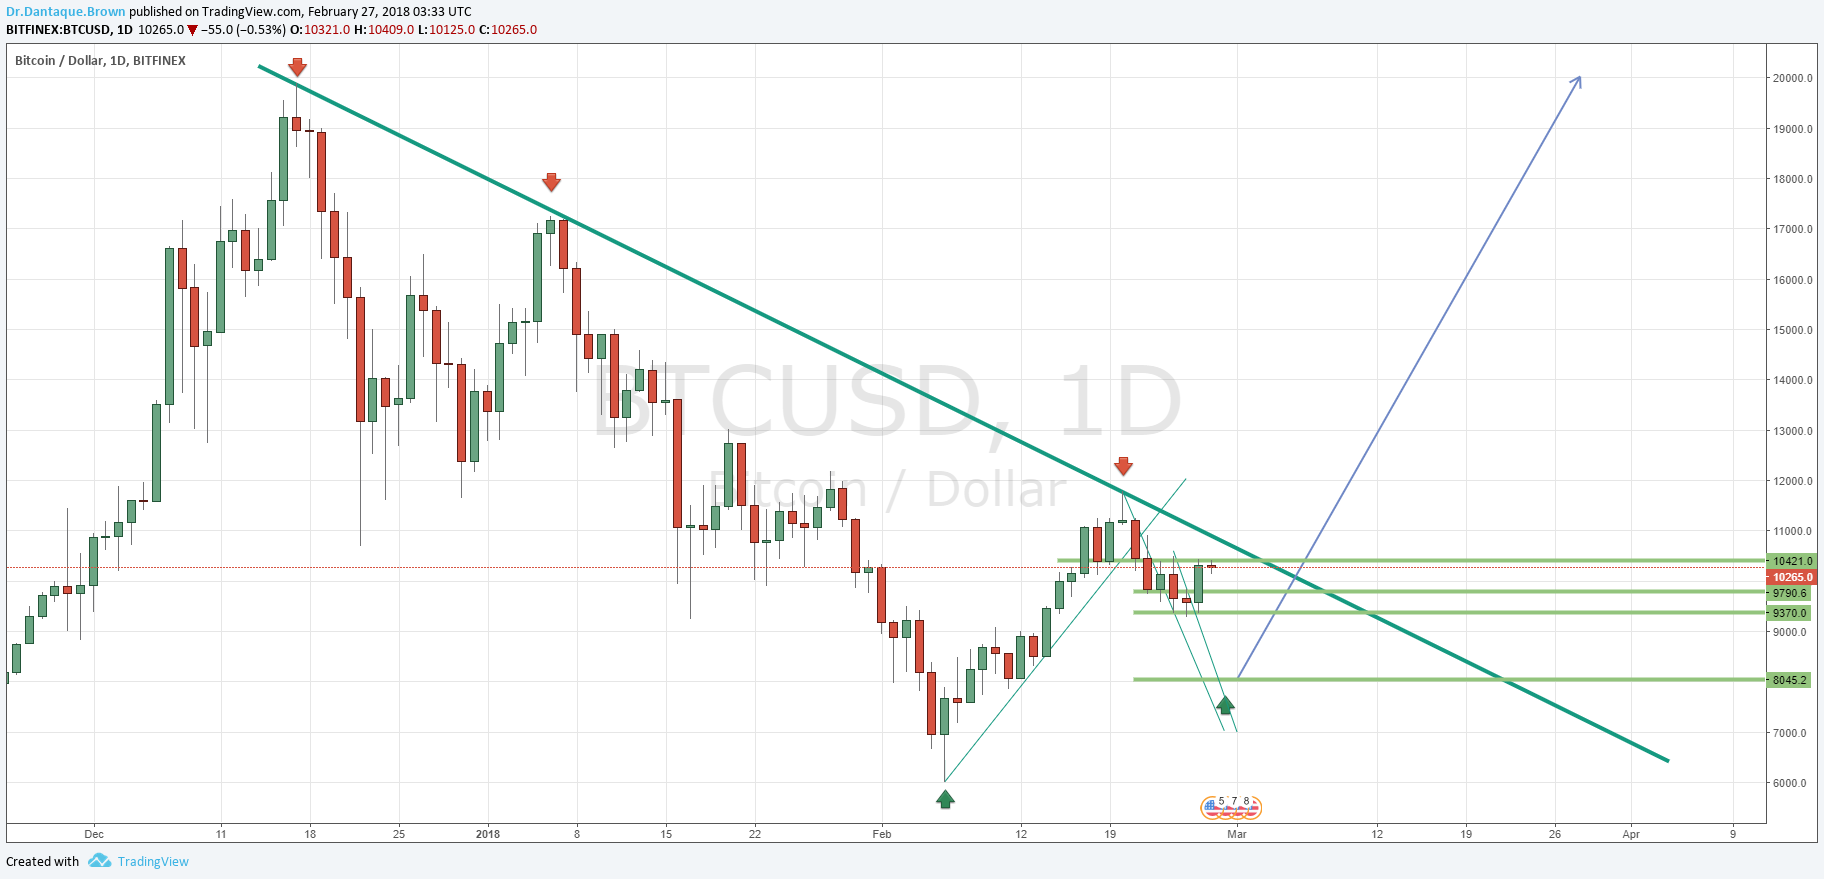
Looking at the daily chart we can see clearly that the bears are still in control but prices seems to be heading to test the resistance of the trendline for a 4th time I really doubt it will break in this thrust but the break is coming soon.

.png)