History of Bitcoin bubbles - More hard data to speculate with
Hello my fellow steemians, I hope you're having an amazing day today, wherever you are & I want to thank you for being here :)
There has been a lot of speculation recently about whether we are on the top of a bubble or on the beginning of one. In my last posts I have been sharing charts showing how the last Bitcoin bubble (2013-2014) compares with the current 2017 one.
But today I wanted to put together all the bubbles in the history of Bitcoin so we have a little bit more data to speculate with.
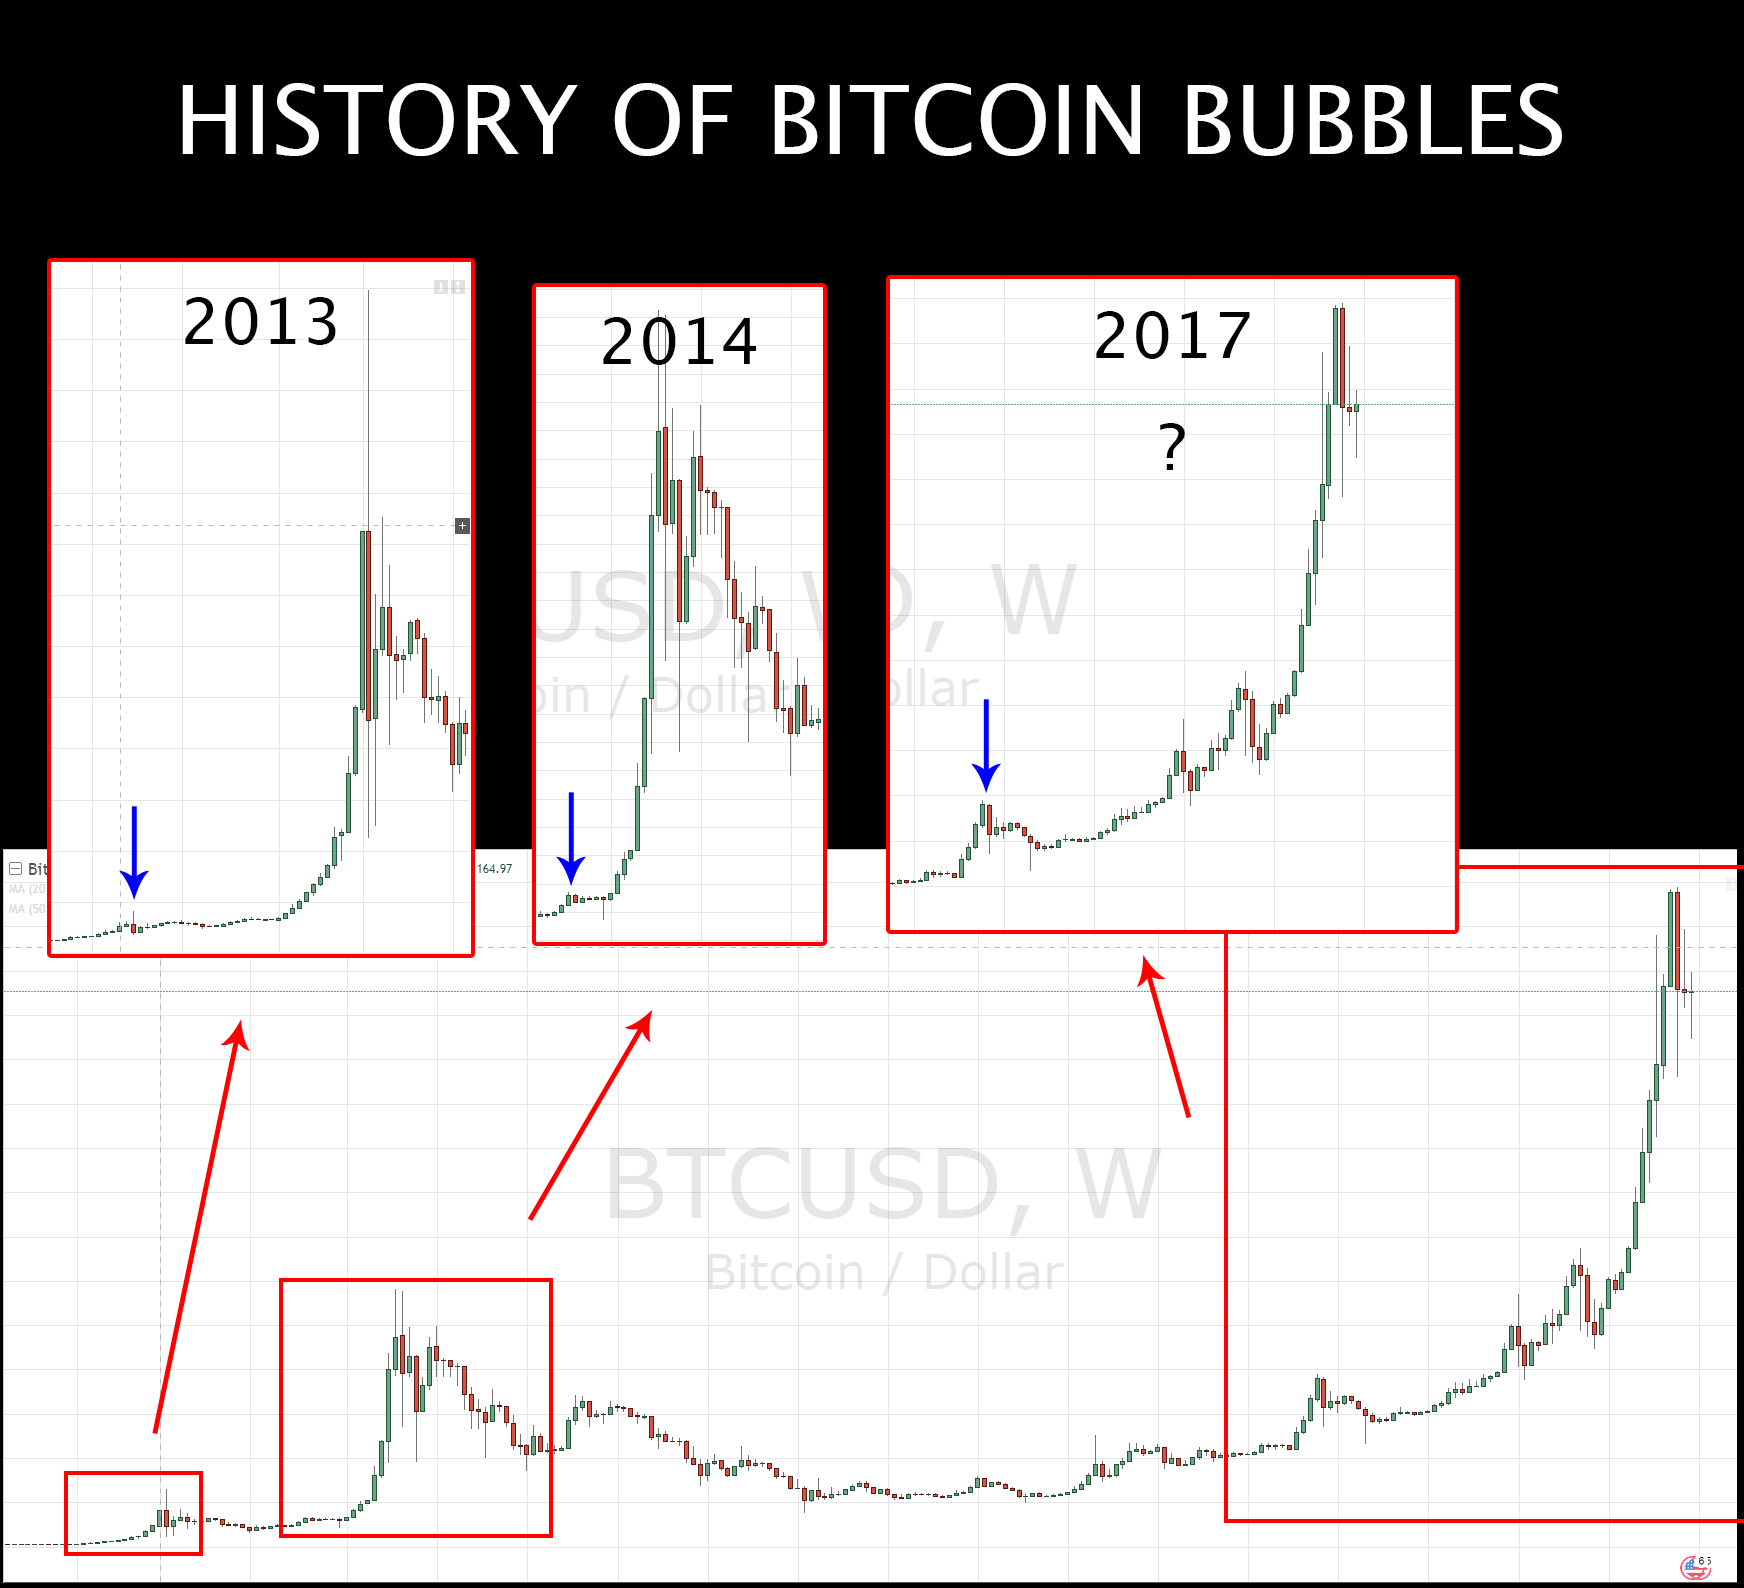
The blue arrows in the shreenshot above are pointing at the first sell off in the awareness phase.
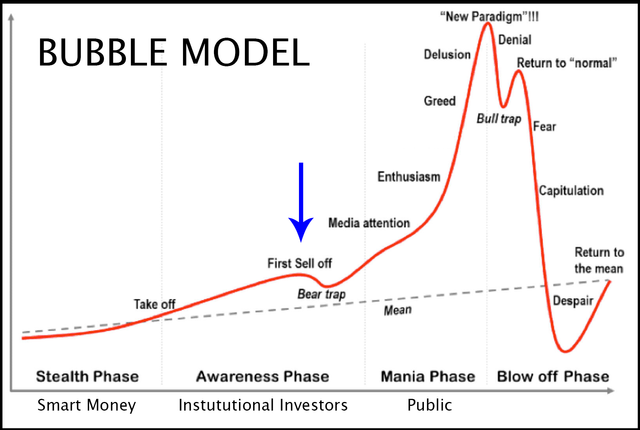
I have been reading articles & watching videos where some people in the community think that the phase we are right now could be the 'first sell off' in the awareness phase instead of the 'bull trap' in the blow off phase.
Conclusion:
To me it seems more like we are in the blow off phase but it is true that this time the price only went up by three times instead of 5 times or 10 times like in the previous bubbles & also this bubble took 3 months to form instead of only one, so that could be an indicator that we might not be in bubble territory yet but instead we're still on a bull market.
It is difficult to figure out but in either case, whether we are at the top or at the bottom, if we take the bubble model as example, it's not probable that Bitcoin will spike up anytime soon.
If we are at the first sell off stage, then it means we are going to have a few weeks of consolidation, with maybe a very slow growth. If we are at the bull trap on the top of the bubble then we probably will go down deeper before going back up for the last time & then the big crash would come.
For now I'm holding in there, not selling, not buying & watching the market very closely. Hopefully we will be able to see what's going on in the next one to three weeks.
I'd love to know your take on this one!
what platform u used for charts can't find 2013 data even on coinmarketcap
Posted using Partiko Android