Bitcoin Technical Analysis follow up - More charts & two possible predictions (Flash crash in August?)
WHAT CAN WE LEARN FROM THE LAST BUBBLE?
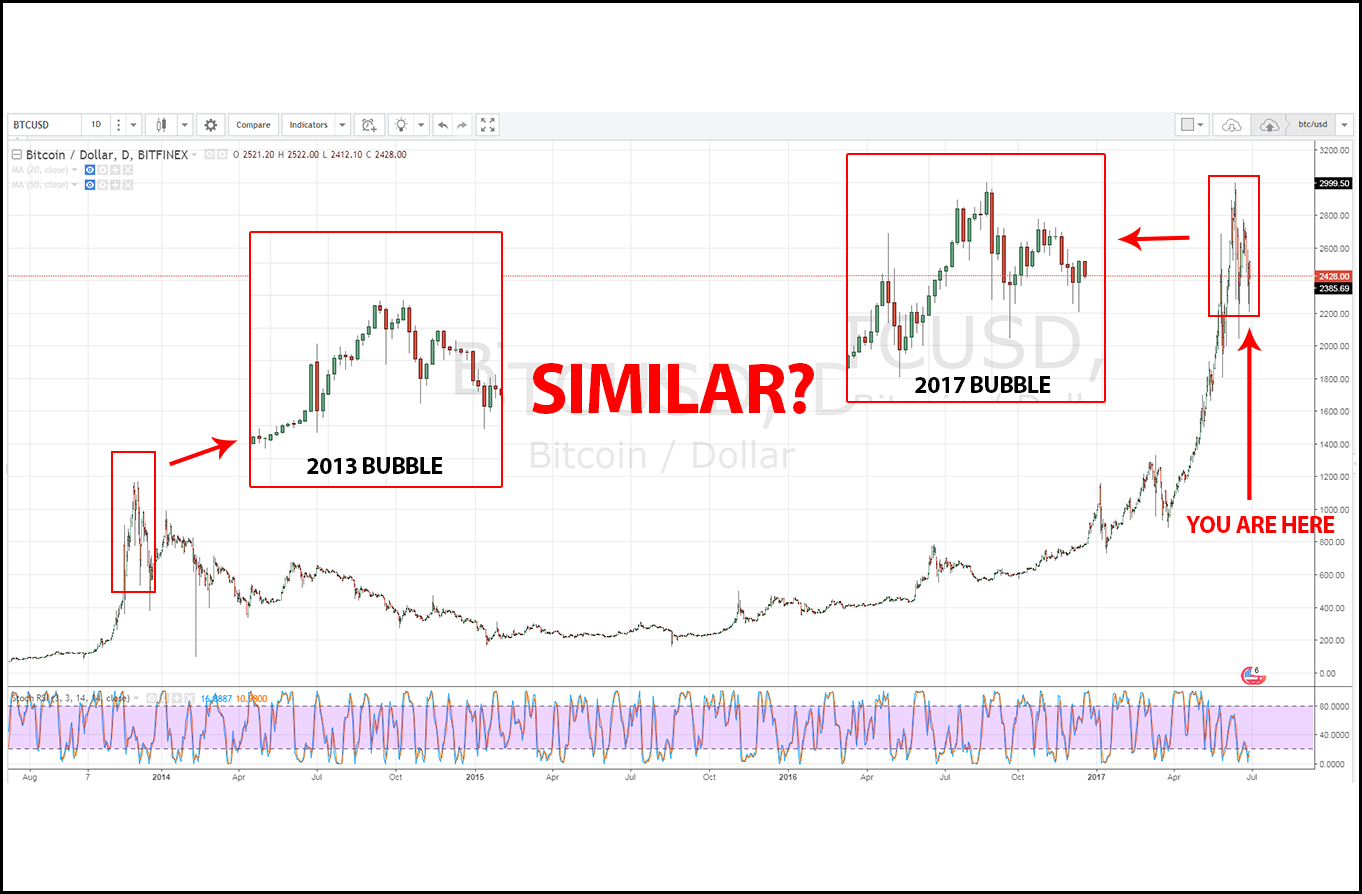
Screenshot 1: Both bubble tops are very similar
Screenshot 2: Is it possible that the trend will continue to repeat?

I CAME UP WITH TWO POSSIBLE PREDICTIONS WHERE TRENDS & SUPPORT/RESISTANCE LINES WOULD ACTUALLY MATCH
Screenshot 3: Prediction #1 - Lowest price by the end of 2017 $2385 (except for the august crash)

Screenshot 4: Prediction #2 - Lowest price by the end of 2017 $2200 (except for the august crash)

Conclusion:
This is of course an approximate prediction on the general trend that we could see IF the pattern from 2013 continues to repeat. The pattern has been consistence for months now BUT it's very possible that the pattern will break at anytime now and the price could move to any direction. Also note that the 2013 bubble formed and burst in one month only while the 2017 one took three months to form and burst. The 2013 bubble grew by 5 times since the parabolic movement started and finished, while the 2017 one grew by 3 times only. This means that the time frame in both future predictions are not very reliable, and we should only consider the general direction of the trend. Although it's interesting to see that the prediction shows a massive crash by August which could very well have something to do with the anticipated Bitcoin fork/scaling issue.
What did you think about all this? Do you think the trend will continue to repeat? Do you think we're going lower than these predictions? Or do you think we're going to go up from here?
I would love to read your different opinions and also what are your strategies for the near and long term future in cryptos?
As always, thank you very much for upvoting & I hope you have a beautiful day today, wherever you are <3
Very good analysis. I say history always repeat itself. Because human behavior and greed never change. That is also why every few years we have recession and financial crisis. kudos to your post!
Thanks for the comment, I agree with that very much!
Hey man,
first of all, let me thank you for this great analysis. Good job. Appreciated!
I just want to make 1 important side remark: in my view, curves may show some periodicity/seasonality (as you claim), but there is also the element of "what's happening in/with the world" and "how people feel".
I haven't checked what caused the 2013 spike, but the 1H2017 spiked was clearly fueled by broad geopolitical unrest, which made investors nervous/anxious and drove them from traditional exchanges to cryptos. Ironically, when things go bad in the world, you may expect cryptos to do well...
Anyway, my point is (and I am sure you are aware of this) that we should not only be focussing on graphs, but also (1) have a look at what's going on out there and what may happen in the near future (especially on a geo-political level) and (2) factor in that the majority of investors are acting emotionally and will base their investment decisions on fear/euphoria (which will be caused by (1)).
Hi thanks for the comment. My opinion is that the the technical leads the fundamentals & not the other way around. What I mean is that when the chart speak so loud, no matter what is going on in the world, there may be some unexpected event in the world that will synchronise with the chart. Why the same patterns keep repeating through history? why a support or resistance line that formed in 1972 keeps holding true through years, decades & centuries? This is just my opinion but as far as I'm concerned there is no empiric explanation for technical analysis, we just know that it works, just like we don't know why the Fibonacci sequence appears everywhere in nature, we only know is there because we can see it and measure it. For the same reason it appears on the charts, it seems is just how the universe is designed.
Hi,
thanks for your reply.
Though I admit the idea of a grand design (of the universe) is appealing, personally, I don't believe in that. The way I see it, an observation can be explained either by (empirical) facts or, if that isn't possible, by human psychology.
The argument you raise about a long standing resistance/support level. Well, if a certain level repeatedly seems to be a level of resistance/support, we will start believing it will be so again, next time. Why do we believe that? For the sole reason that it was so in the past. However... history will only repeat itself a limited number of times. If history repeated itself indefinitely, it would be all too easy to predict the future.
You justify technical analysis by stating "that it works". I am not denying that. However, there have been many studies, showing that behavioral psychology-based investing outperforms technical analysis. So, no, I don't think one should put all his eggs in the TA basket.
And about the universe: human nature shapes the universe. Not some intangible super creature :-)
Good TA!
Yes, bitcoin chart was parabolic. Usually after such a move, you get an exhaustion, correction and consolidation. How long (or deep) consolidation will be is a guess of course. And it is a subject of other news. More talks about crypto currency taxations, banning.... lower price will go. So kind of war, or Russia acceptance of it, would stop it right away. But if there are no earth shaking news, it is a good bet to expect bitcoin to consolidates for a while.
Agreed!
On this chart it doesn't look like a bubble.
hi- just found this post, I commented on a more recent one you made but I think they both have a similar view which is interesting. There is a probability of a bubble, but whether or not it plays out like the previous one is hard to say. From what I see in my chart, it could happen if we break the green trendline and hold below 2100 area. If it breaks the upper red line, then we might be looking at testing the ATH. The compression is significant, we will see a major move coming soon. Up or Down? We do not know yet . I find your analysis in contrast to mine, which is helpful since we need different viewpoints to keep ourselves in check -cheers
Hi thanks for this. To me the bubble is very clear & I really believe the price will correct. But in the case of bitcoin the bubble is not as blown up comparing to other cryptos, so I believe cryptos will crash very heavily while bitcoin could have more of a soft landing. If the price breaks up your red resistance line I think we will be consolidating around there, I don't think we will test ATH again. But let's see what happens. I'm personally ready to sell the rest of my bitcoins any time. I will keep only one cause I love Bitcoin so much to sell them all :P but I expect to buy them back for cheaper sometime later this year. Fingers crossed!
Yep anything in trading is possible. Yes a lot of cryptos charts will end up with the 'Eiffel Tower' pattern if you know what I mean. Possible that BTC consolidates higher. But bear in mind bubbles can last longer than you think, and IF there's any major world event and fiat currencies take a hit because of the stock market bubble, it may impact on the price of BTC. Good luck on your BTC trade, can always keep a little bit and not sell it all unless you bought late. Currently I hold a small position short on ETCUSD. If it lasts more than day at the levels now I will be covering.
I've learned not to predict the future. As traders holding a strong bias can hurt more than not, so it always helps to remain neutral with a small bias in case things change and you get stubborn trying to prove yourself right. Maybe I haven't been checking the bitcoin tags often (I am in my own bubble lol), but is good to see interact with traders and not HODL investors as you often see in this platform. I have a feeling, I might be wrong though, that long time steemians don't want to hear people saying things can turn south and when that happens run for the hills. They've stuck around when steem went from $4 to $0.12! Seen the good and bad, so post like yours won't be popular :). Trading is not popularity contest.
Well, I see you don't follow many people, it would be good if you add me to your feed but don't feel obliged to -cheers.
Hi thanks very much for the thoughtful comment I really appreciate it. It might seem I'm a trader but I am not. I acquired my bitcoins and alts around four months ago and I've hodled all this time. I only traded LTC & NEM once, to grow my BTC hodlings. But I do not trade normally, I'm only selling now cause I can see the bubble very clear so I'm expecting to buy back in for a lot cheaper and hodle again til the next bubble. I will check your blog right now mate :) Cheers!
Thank you for good analysis and predictions.
I miss high quality content on steemit
Thank you very much for your comment. I really appreciate it :)
interesting chart