Bitcoin Price Weekly Analysis – BTC/USD Breakdown is Real
Bitcoin Price Weekly Analysis – BTC/USD Breakdown is Real
Key Points
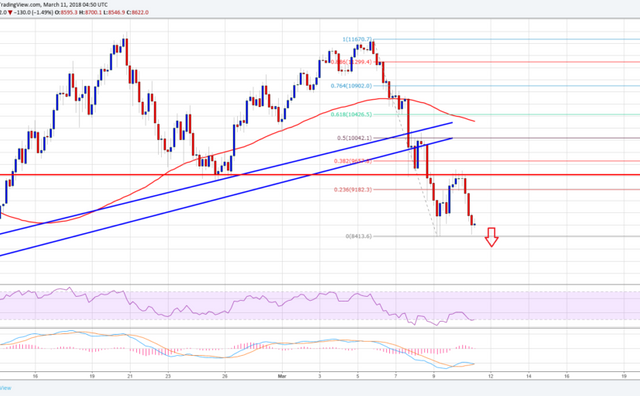
Bitcoin price is trading in a bearish zone below the $9,400 support level against the US Dollar.
There was a break below two major bullish trend lines with support at $10,000 on the 4-hours chart of the BTC/USD pair (data feed from Kraken).
The pair is trading lower and it may perhaps break the last swing low of $8,410 for more losses.
Bitcoin price is currently under pressure below $9,400 against the US Dollar. BTC/USD remains at a risk of more declines towards the $8,000 level.
Bitcoin Price Decline
It was a major bearish week since bitcoin price declined by more than 25% against the US Dollar. The price traded lower and broke a couple of important support levels such as $10,000 and $9,400. The current decline has opened the doors for more losses and it seems like the price may even test the $8,000 level. More importantly, during the downside, there was a break below two major bullish trend lines with support at $10,000 on the 4-hours chart of the BTC/USD pair.
The pair is now trading well below the $9,400 and the 100 simple moving average (4-hours). The recent low was formed at $8,413 from where an upside move was initiated. BTC price traded above the 23.6% Fib retracement level of the last decline from the $11,670 high to $8,413 low. However, the upside move was protected by the $9,400-9,500 levels. The stated $9,400 level was a support earlier and now it is acting as a barrier for more gains. The pair resumed its downtrend and it may soon retest the $8,400 level.
For more info visit: https://www.newsbtc.com/2018/03/11/bitcoin-price-weekly-analysis-btc-usd-breakdown-real/
For future viewers: price of bitcoin at the moment of posting is 8731.90USD
it's always fluctuate now $8,760.00