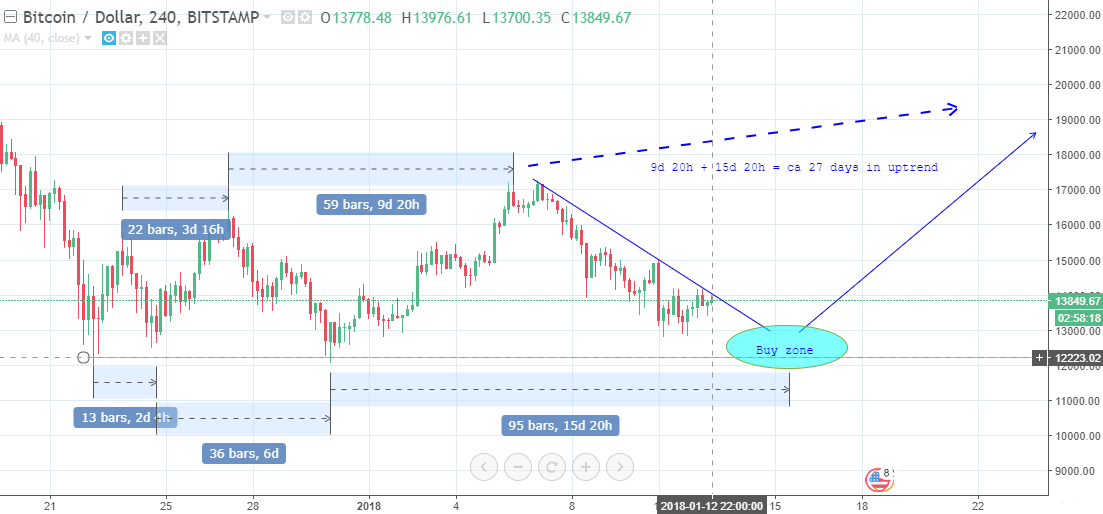
Fibonacci timeline idea for the BTCUSD chart.
I would like to share my idea about the future of BTCUSD prices - check out the chart.

What if we could forecast the next price reverse using the Fibonacci row.
1 bar = 4 hours.
The lenghts between the tops and the bottoms of the latest price movements returns us almost perfect fibo match:
13 + 22 -> 36
36 + 22 -> 59
36 + 59 -> 95
95 + 59 -> 154 / 4h = ca 27d
95'th bar falls on the 15th of January, so we could expect that current movement down will last for ca 3 more days and the price will get to $11500 - $12200 territory. If the price will reverse here, the next upward movement could last for ca 1 month and bring us to the new heights.
In my eyes, we have enough reasons to expect the next jump:
- A lot of newcomers are looking for the entry point and they will definitely support the upward movement.
- As we see on the chart, movements down are getting less and less sharp - buyers are getting more confident.
- Strong support zone is formed near $12000 - plenty players are waiting for the cheaper bitcoin - these who did not buy in previous spikes. I guess they will act very fast when see the prices of 11k
- Correction lasts since the 17th of December - 1 month. Isn't it enough? We have even seen $10000.
What do you think about that, folks? Please share your ideas.
is true predict btc can reach to the 100000 dollar and if we invest long term we can get huge profit
Imagine the news if BTC price is 100 000 EUR
Bitcoin has potential to reach higher then 100K.
Sounds good! I also use fibonacci a lot
Let's see what will happen in 3 days...
indeed