BTCUSD chart: Elliott Waves, Support Levels, Trading Corridor
Ok folks!
First of all, the corridor:

We hit the mid-line is also an orienting. We are about to hit it now.
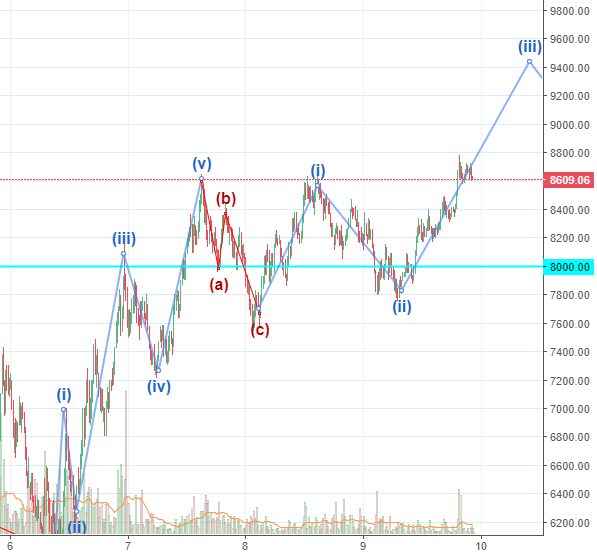
If we are in the new impulse now there are two options, that I see:
Flat correction:
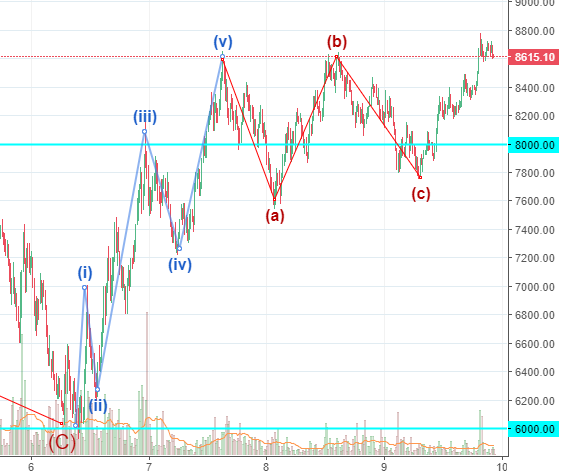
ZigZag and the Impulse:
I do not consider both as good pattern and wave count.


In that situation, I still keep the neutral position, because:
- the first wave pattern (after the C bottom) does not look brilliant
- the correction pattern is not clear
- the midline of the corridor and $8 000 level can both be support and resistance levels.
My plan is to catch the spikes (below $6 000) or to buy in if the clear wave pattern will be detected.
Comming back to you soon with new updates.
Stay tuned!
Yup, i am more inclined with the flat correction i see no real bull strength, i mean look at this 1h chart, we can't even close a higher high on the 1h, unless its a price manipulation, i haven't really had time to look at the order books.
I do not see any clear pattern before "correction"...
I also cautious but getting more optimistic as the bounce has stabilized instead of large pockets of selling. Volumes have been higher thay average too so I think we have gotten to the point that there are fewer sellers in the market. Where we go from here may determine where we ultimately trend. Thanks for the update!
And it is still sideways...
@echowhale team members swimming by with your upvotes