BTCUSD 15 min chart. Subminuette zoom in: Elliott Waves. Target: $9 900.
Ok, folks.
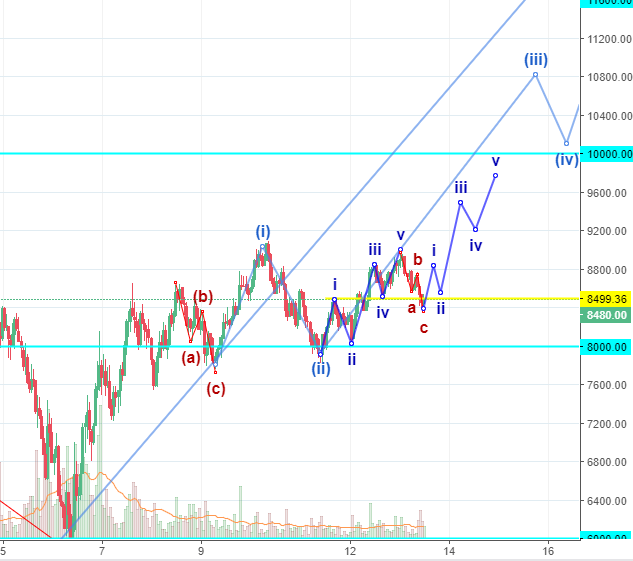
The image from yesterday post:

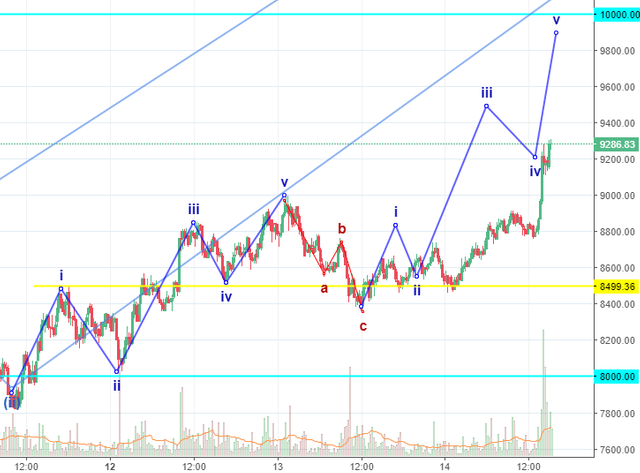
Same wave without editing today (zoom in):

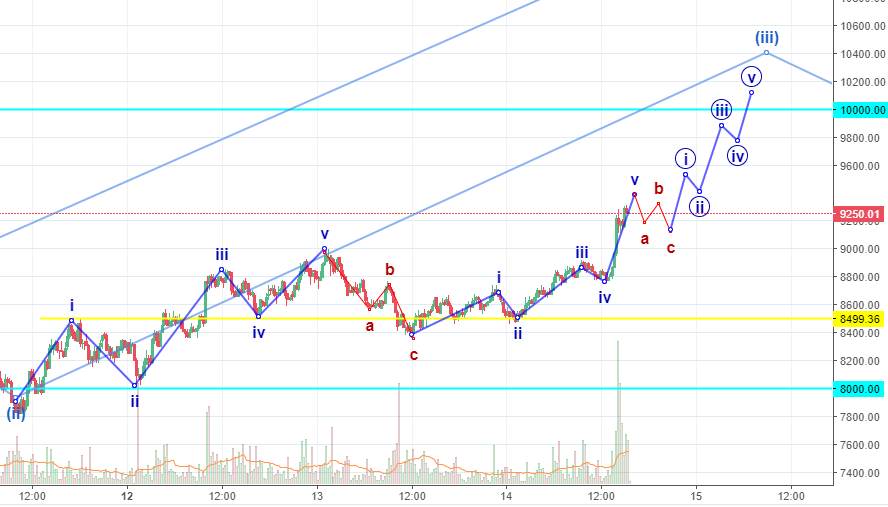
Edited and zoomed out:

That is my positive scenario. And that is my wave (iii): 5-3-5-3-5. Beautyful!. NB! that can also be C in double zizgzag, but it does not matter until the impulse is done. I consider that fact when setting up the price target.
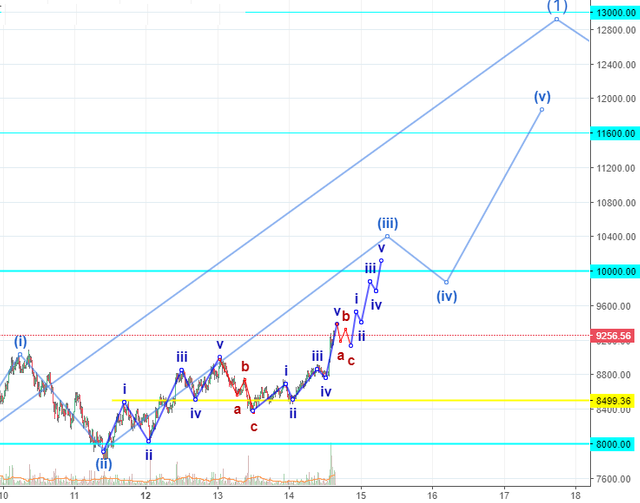
Zoom out to see the wave (1) on the higher level.

And here comes my price target: $9 900.
BTC if fine to spike the support/resistance level, so I put the (iii) above the $10 000 and v a bit below it (to my pricing target). v can be extended and there is a high chance that we will see a price reversal (double zigzag idea) somewhere very close to the $10 000 level. Trade on with the stop-loss orders a bit below $9000.
Stay tuned!
Great charts, thanks! Looks like volumes ate confirming the breakout as well! Thanks for the analysis!
Superb work very easy to understand and track keep them coming cheers
thanks for the feedback!
@echowhale is now a little charged up and awake.thanks for waiting patiently.
Swimming by with your upvote