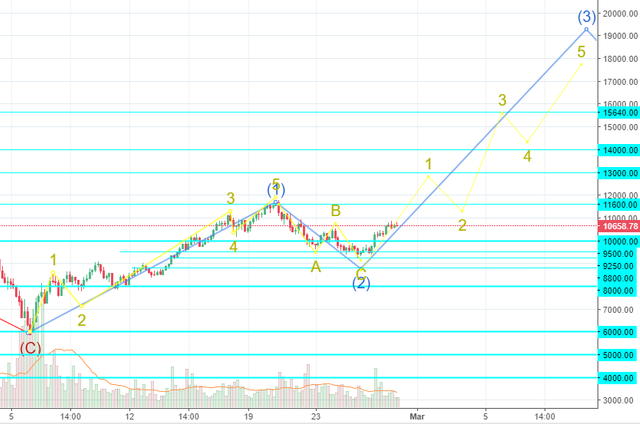
BTCUSD chart, minute level: Elliott Waves and Support Levels.
OK, folks!
The first minute-level impulse seems to be done and now I see the corrective movements:

I do not think it will be the deep correction, so my plan is to buy in and set the stop-loss near $10 250.
The abstract picture of my primary scenario:

If the pattern is correct the 3-rd wave can bring us to the over-16000-bucks heights.
Currently, my target is 11 600. I will wait for the confirmation of my scenario and if we will get to the top of the (1) wave I will pull my stop-losses a bit higher.
Stay tuned!
My only concern is how volume will hold up. We have seen more volume when selling pressure is on vs volumes with higher price movements. If they do not hold up, support levels may not hold leading to a deeper fall and a break in the trend. We also need heavier volume to confirm any breakout of the $11,500-$12,000 range.