Bitcoin - daily analysis 13th May. Correction end - are we there yet?
Hi Everyone,
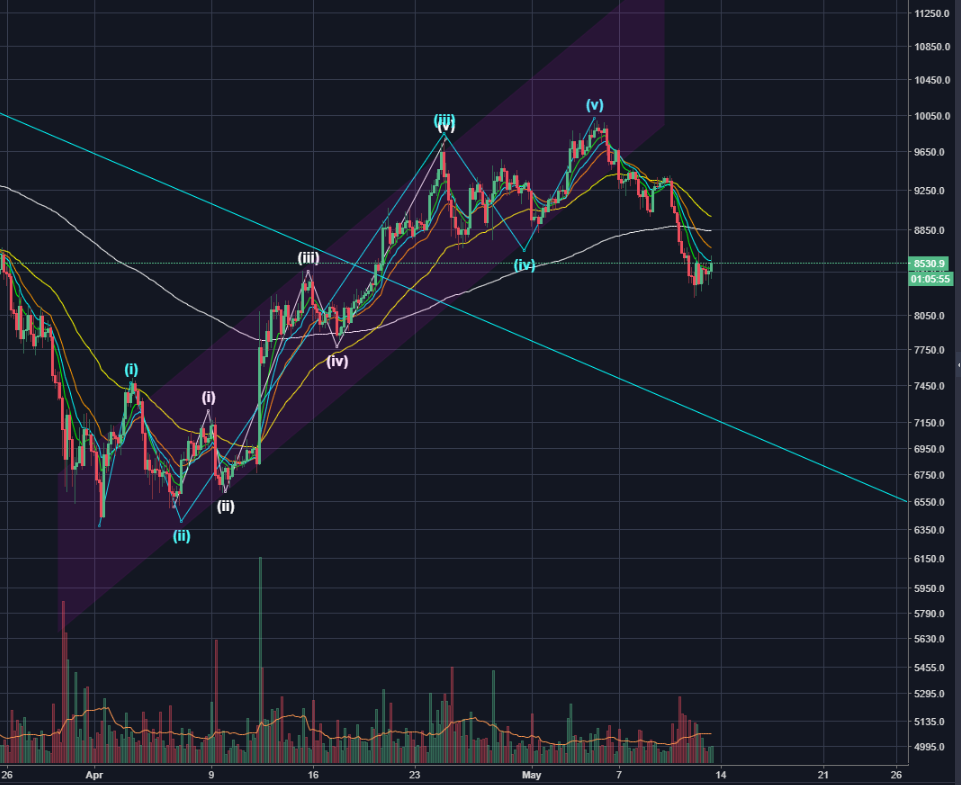
BTC has been correcting for nearly a week now. This was preceeded by a rise from $6,400 region to nearly $10k! (We missed it by $10, dang...so close...). From an Elliot wave perspective we can see a 5 waves count as well (although not the easiest!).
Please up vote if you like this post!
We are in the ABC correction now and we have seen pretty much non-stop sell off with little retracement stops since it started. The question I'm wondering about is: What's next? What is the target for the correction?
We're currently consolidating following the most recent sell off and I have made an analysis for that here.
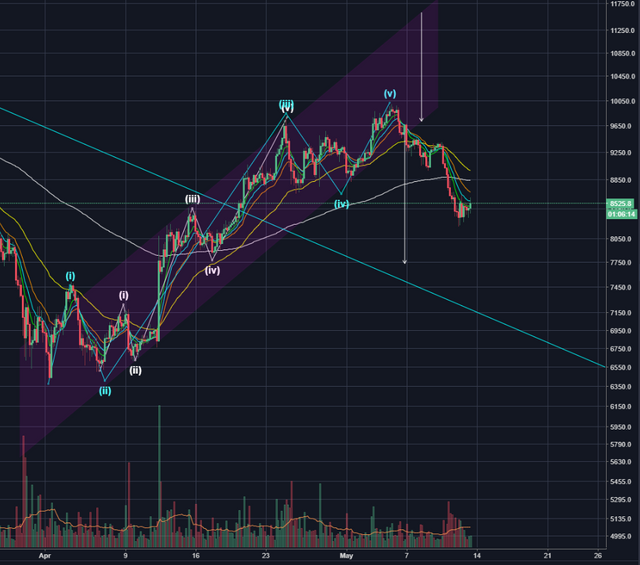
As per the larger ABC correction, we have broken out of the channel formed by the price rising from $6,400.
We can assume price will travel down the distance equal to the width of the purple channel. This is shown by the white arrows.
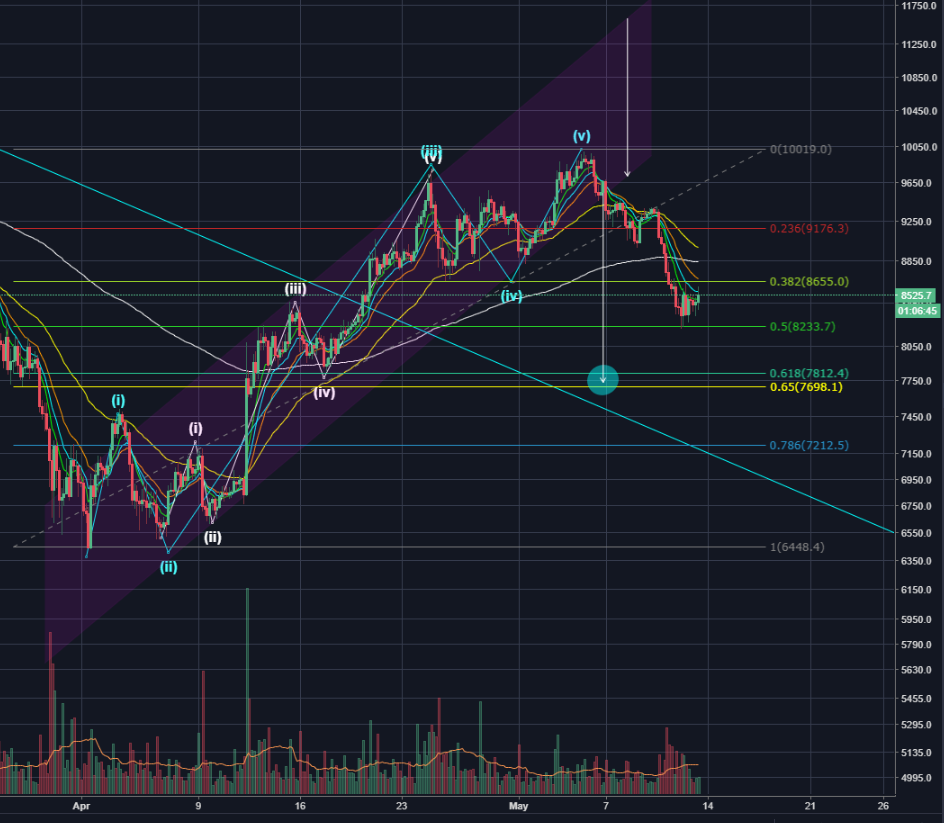
If we apply fibonacci retracement to the 5 wave structure, we can see that the target established by the white arrow matches perfectly the golden pocket fib retracement...what a coincidence!
The question is: how are we going to get there? Are we going to put another leg down soon and complete a zigzag? Or is the price going to revert short term and go up to for a B leg of a flat?
It is impossible to say until we have further data available but here are some possibilities:
A) A zigzag -complete
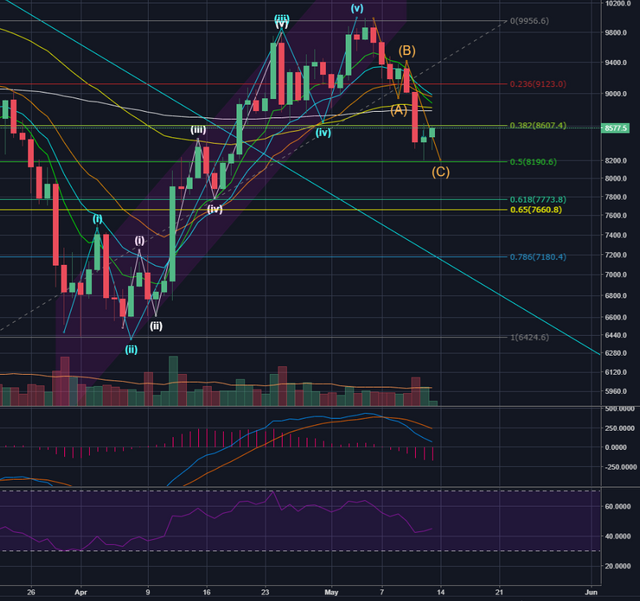
In this count, ABC retracement is complete and the price can resume an upward trend. I think this is not very likely for few reasons:
- the retracement of this ABC has barely touched the 0.5 retracement. It doesn't look like enough of retracement for a big move preceding it. Also, the price barely touched 0.5 by a wick. Usually, price likes to go over the target with a nice long wick, something 50% -70%, so I don't believe even the 0.5 fib is complete yet and that the price will try to re-visit this level
- MACD is in full 'sell' swing
- RSI is in a downtrend and has plenty of room to go down
B) A zigzag - not complete
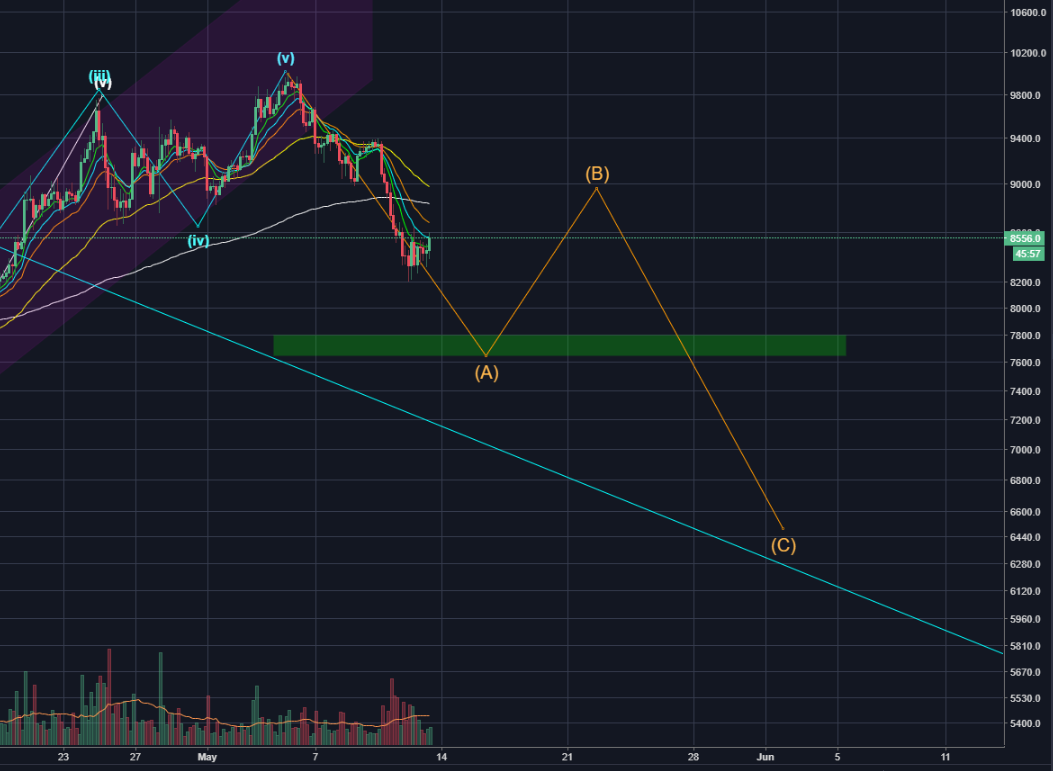
To me, this is the most likely scenario right now. Mostly because I believe there isn't enough strength but enough of a strong wave B up at this point.
B) A flat
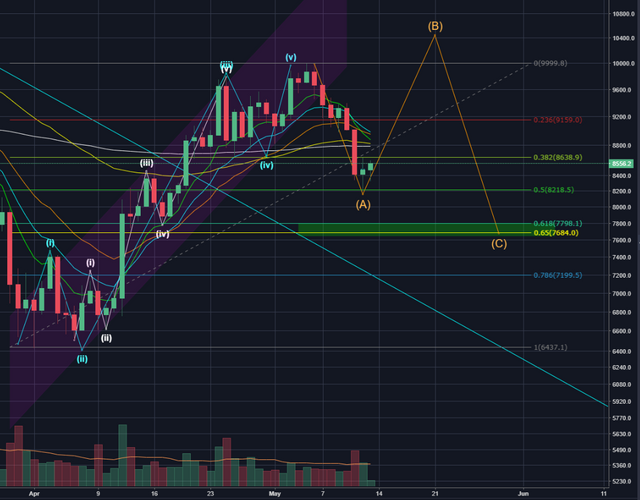
I personally don't think that we will see a flat, mainly because there is lack of evidence from RSI and MACD to support this scenario. As you can see on the picture below, MACD has given a sell signal few days ago and histogram is downticking. RSI is in the neutral zone, but the preceding trend is downwards, following RSI peak on daily around 23rd May. So overall, I can't see the evidence of strength required to push the price up to the previous peak and beyond.
Please up vote if you like this post!
Legal Disclaimer: I am not a financial advisor nor is any content in this article presented as financial advice. The information provided in this blog post and any other posts that I make and any accompanying material is for informational purposes only. It should not be considered financial or investment advice. I do not take any responsibility for how you choose to apply this information.
Wow nice post. Keep em coming. will folloy you for more in the future :)
Congratulations @digitalisbetter! You have received a personal award!
Click on the badge to view your Board of Honor.