Bitcoin (BTC) Price Update: Breakout from Descending Triangle?
Hi guys!
I guess I was wrong yesterday! It looks like bitcoin closed above $8,000 yesterday. So, here are my thoughts on bitcoin for today.
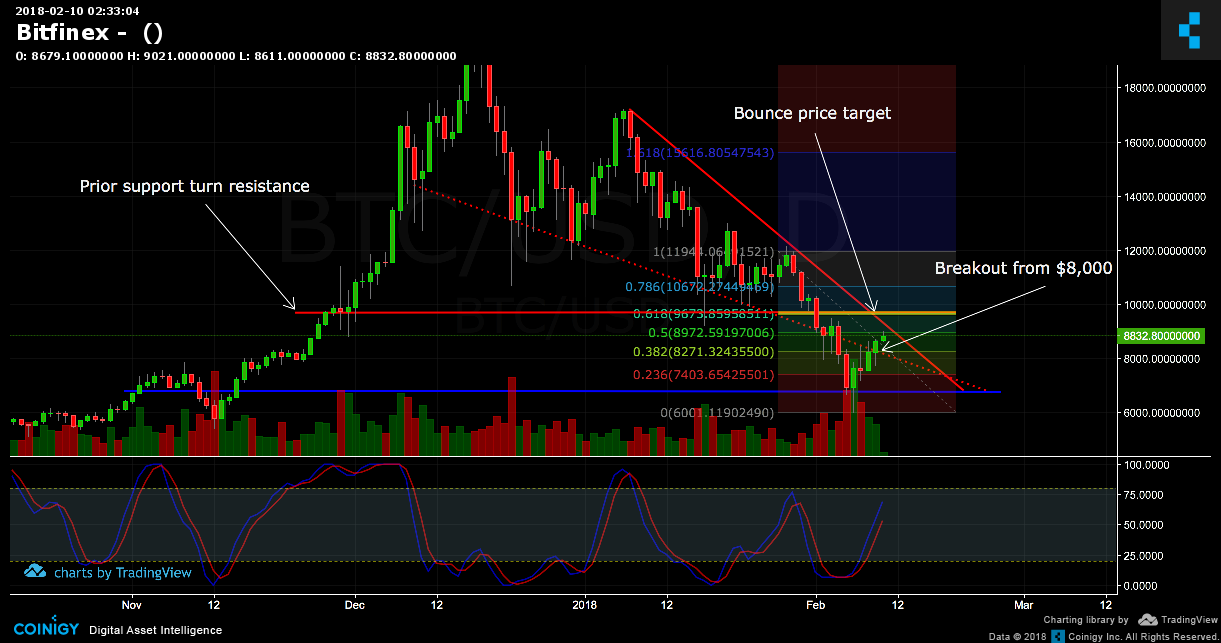
BTC - Daily Chart
Tools used: Trendlines, Fib Retracement and Stoch RSI

To break this next resistance (descending triangle) bitcoin has to closed above $9,300. Looking at Stoch RSI it seems like bitcoin still has momentum for this run up.
The next resistance if on the chart is $9,700 because:
- This is prior support before the parabolic run up.
- This is a probable target price for a bounce from the last dip.
FYI: if bitcoin failed breaking through $9,700 and breakdown or have another dip, the next target price would be $5,000 (based on fib extension).
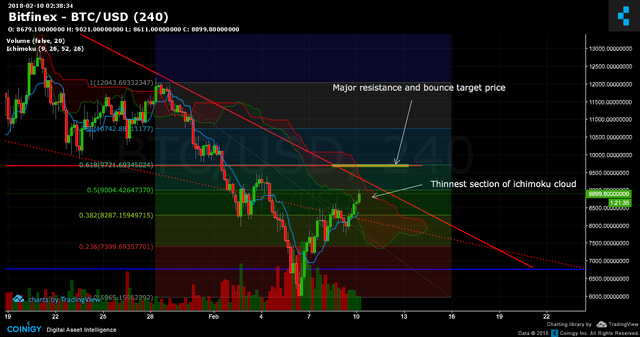
BTC - 4 Hour Chart
Tools used: Trendlines, Fib Retracement and Ichimoku Cloud

In shorter time frame, bitcoin is travelling through the thinnest part of ichimoku cloud (path of least resistance).
Note that the last breakout from ichimoku cloud failed and bitcoin had a breakdown instead. So, I will keep my eyes on $9,300 price closely because this will be make or break for bitcoin.
Disclaimer
You know the drill guys. This is just opinion and not a financial advise. Do you own research and decide your own trades. Cheers!