Daily Bitcoin/BTC Price Action Review (03 Mar 18)
This is not Financial advice: Do not trade or invest based on this analysis.
Following on from yesterday's review (here) BTC is building on its recent strength and is now trading comfortably above $11,000.

The next overhead resistance is the range between $12,000 and $13,000 which forms the 'neckline' (N/L) area of the inverted head and shoulders pattern that I've been stalking for the past week.
Currently, there is nothing to invalidate this setup, so it could still play out (with an upside target of $17,000).
The immediate interest is whether BTC can make a higher high and another higher low, which requires it to trade above $12,000 and then pullback to perhaps $11,000.
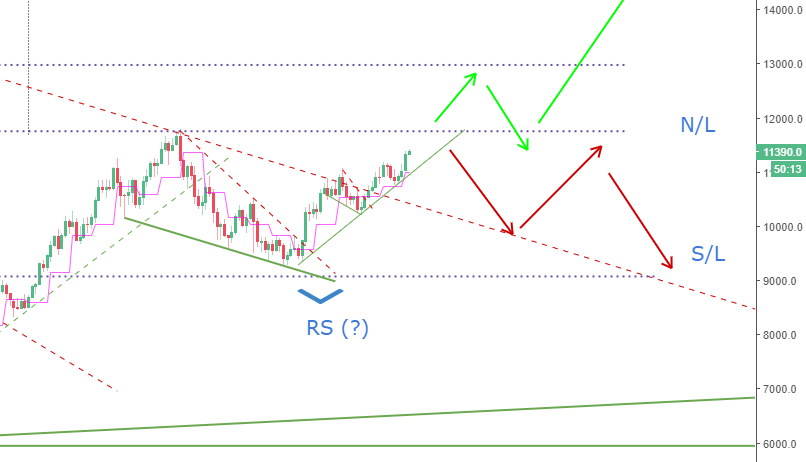
This price action would establish confidence in a potential bull trend.
The bearish scenario would be if BTC fails to trade above $12,000 in the next few days, in which case, I see further price consolidation between $10,000 and $12,000, at least while the On-balance-Volume indicator doesn't break support:

If the price fails at the $12,000 and the OBV breaks down significantly, I can then see a more dramatic sell off, possibly with a return to $9,000.
However, my bias is currently bullish: looking for a test and break of the $12,000 (neckline) level.
Until tomorrow,
Bobby.