Bitcoin (BTC): Price Action Review (Wed, 18-Apr-2018)
For education only.
Price (retracing)
Following on from yesterday's review (here), the BTC price has continued to fall below the $8,000 level.

This was expected following the recent run up and the price did form what could be described as a mini head-and-shoulders pattern with the neckline around the $8,000 mark.
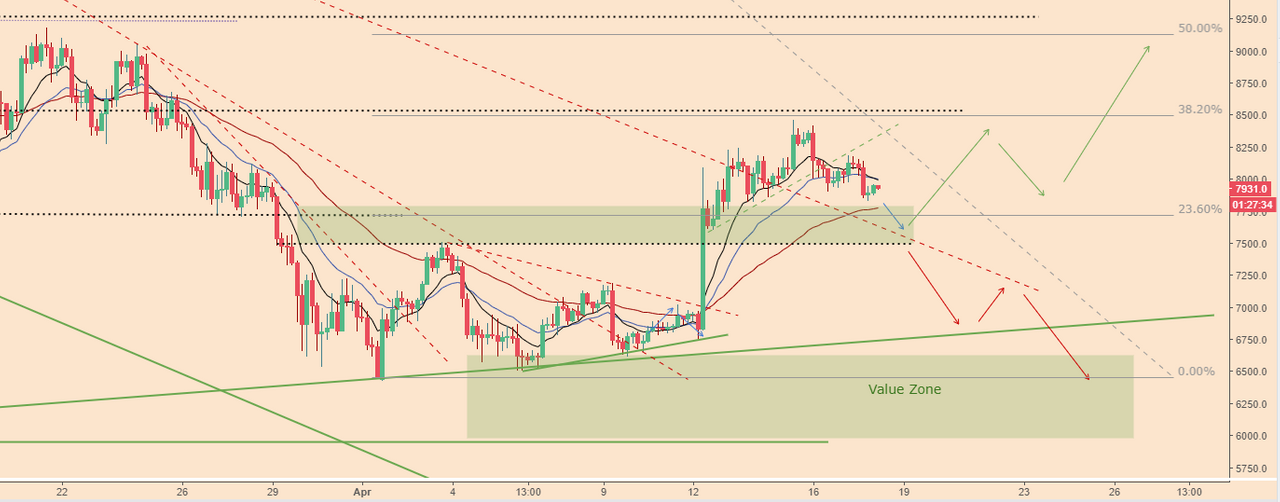
The projected target for this head and shoulders pattern approximately coincides with our retracement target of $7,600 (if not a bit lower), so if this pattern completes it will support our proposed long trade setup.
Indicator Check (downside, convergence)
Using the MACD (black, red and blue) and RSI (purple) indicators to check for agreement, they are supporting the current price action to the downside i.e. they are not signalling stregnth.

Volume (flat)
The trading volume and On-Balance-Volume Indicator (Bitfnex) is flat, indicating no real bias either way.

Trading strategy (pullback, consolidation, long)
I'm still looking for a further pullback to about the $7,600 level, where the project H&S target 23.6% Fib, broken descending trendline and 50 period moving average all coincide, so there a reasonable chance of catching a bid here (i.e. buyer support).
At that level we're looking for a small price consolidation and then a break to the upside, which will be our long entry.
Until tomorrow.
Bobby
(Trader)