BTC Volume on Bitfinex 4 Hour Chart Over Double Previous High
When looking at a bounce, resistance break, or any price rise, the net volume on the surge is a key indicator because it confirms there is a large number of buyers wanting a stock/token.
Here are the previous highs on net volume, and the net volume on the last period, on the Bitfinex 4 hour chart:
Previous high in net volume: 25,968
Net Volume on last 4 hour period: 58,348
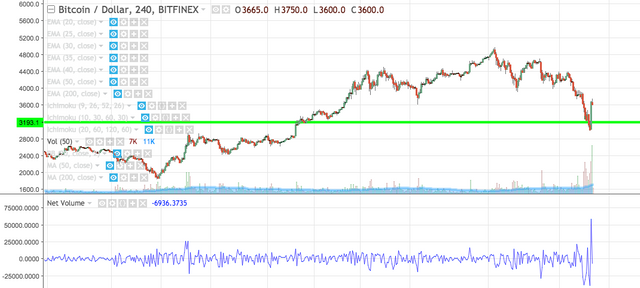
The blue line under the price graph shows the net volume: BTC bought - BTC sold. Of course on a large surge the volume will be higher than usual, but 2x the 2nd highest volume ever is a strong indication that this pullback is real: we didn't have a pullback on low volume which shows not all that much buying power pushing the rise, but instead on huge volume that shows the buyers have much more power than the sellers.
I think, at least in the short term, the worst is behind us. BTC is dipping back a little now, but look for it to bounce off $3,500 as a new support. Congratulations to all who bought the fucking dip!
My name is Ryan Daut and I'd love to have you as a follower. Click here to go to my page, then click  in the upper right corner if you would like to see my blogs and articles regularly.

I am a professional gambler, and my interests include poker, fantasy sports, football, basketball, MMA, health and fitness, rock climbing, mathematics, astrophysics, cryptocurrency, and computer gaming.