21th September 2018 Daily Trading Commentary | BITCOIN | ETHEREUM | LITECOIN

Friday | 21th September 2018
Good Day all my beloved students & steemians. Inside this daily commentary I will share the short-term technical outlook and trade ideas for Bitcoin, Ethereum and Litecoin.
 Previous commentary refer here: http://bit.ly/btcethltc200918
 My core strategies refer here: http://bit.ly/taicorestrategies
 WARNING
Do not attempt to use any of the trade ideas contained within unless you have attended my classes and understood the risk and money management behind these ideas.
 Full Disclaimer refer here: http://bit.ly/tai-disclaimer
Want to own Bitcoin rather than ETF trading, check the two link below:
 Honey Miner : https://honeyminer.com/referred/59hvc
 CryptoTab : https://get.cryptobrowser.site/2402149

 You can also follow my FITS:
Facebook - http://bit.ly/danielang_fbpg
Instagram - http://bit.ly/danielang_ig
Twitter - http://bit.ly/danielang_twitter
Steemit - http://bit.ly/danielang_steemit
BTC/USD
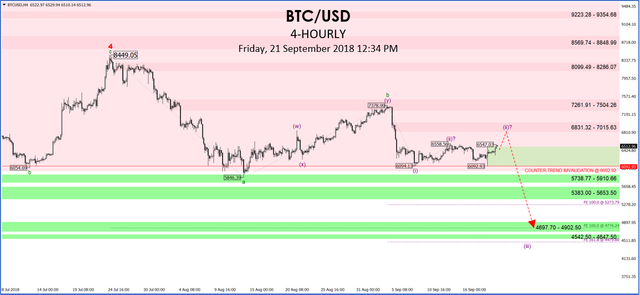
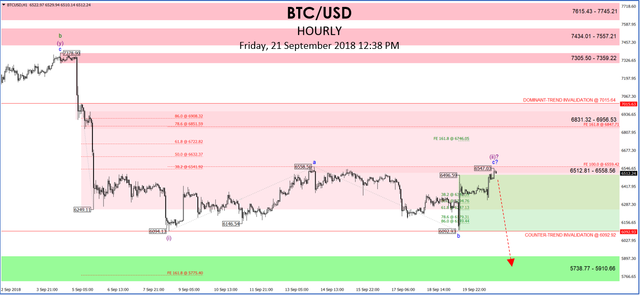
BTC spiked higher early this morning to just above $6500.00 before easing back a little. On the face of this spike, the counter-trend rise from 6092.92 may either extend higher towards the $6831.32 - $ 7015.63 as seen in the 4-hourly frame or start unraveling from within $6512.81 - $6558.56 as per the hourly time frame chart indicates.
Either way, this rise is seen, for the time being, a technical rebound within the larger degree decline from $8449.05.
If the wave count is correct, we should see another deterioration below $6092.93 towards either the equality target at $5273.79 or $4697.70 - $4902.50 bracket (see 4-hourly chart). However, if there is a surge above 7015.63, a re-evaluation of the bearish scenario needs to be done to ascertain if BTC may has already bottomed out as the bullish view for ETH.
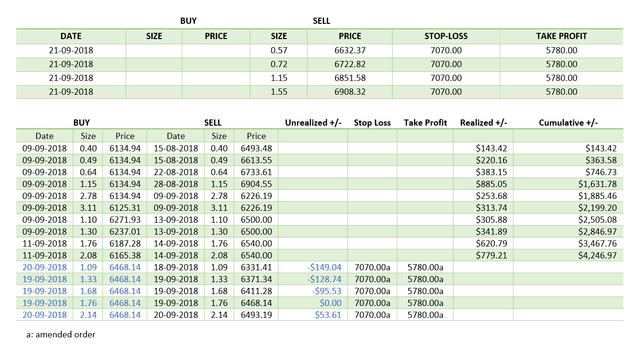
 TRADE IDEAS

ETH/USD
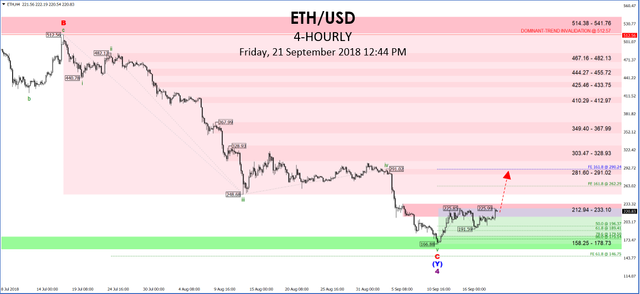
In the 4-hourly time frame, the rise from $166.88 is so far in 3-waves. As to whether this rise has the potential to become a significant reversal is, at this stage, still unclear but the possibility is clearly there.
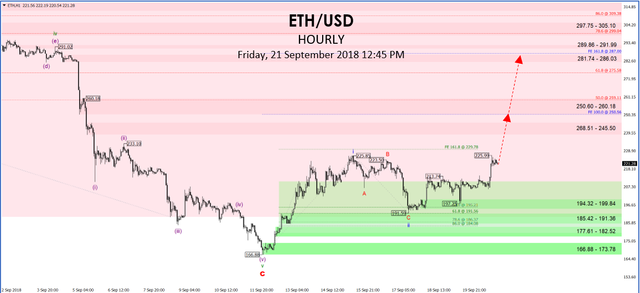
Technically, we need to see a clear 5-wave structure in the 4-hourly time frame to confirm this bullish assessment although in the hourly time frame we already had a 5-wave rally from $166.88 to $225.85. If the rise from $191.59 unfolds into a 5-wave rally, then the odds for a reversal increases.
Levels wise, the first target is the equality measurement of $166.88 to $225.85 from $191.59 at $250.56 which is located just below a supply zone at $250.60 - $260.18. This has bearish implications. This is because if ETH unravels from within $250.60 - $260.18, then the entire rise from $166.88 is seen a correction and another fall below $166.88 is probable.
But if this rally surges past $260.18 and towards the supply zone at $281.74 - $286.03 in a clear 5-wave structure, then a reversal is the more likely explanation.
TRADE IDEAS
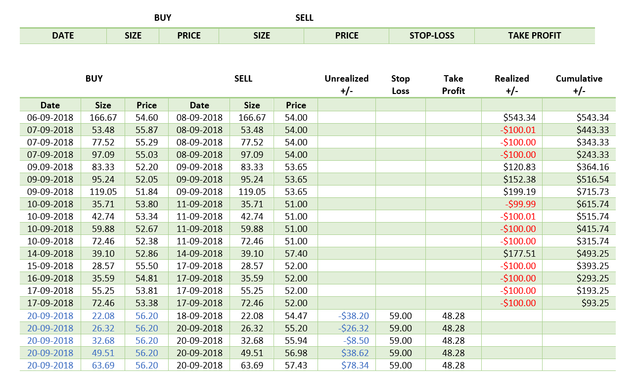
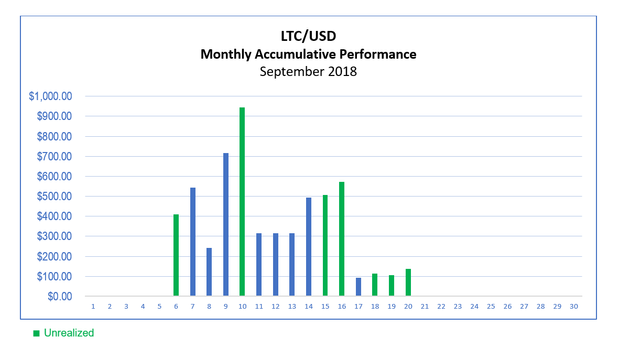
LTC/USD
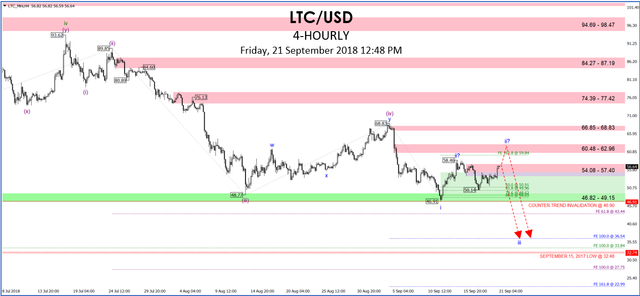
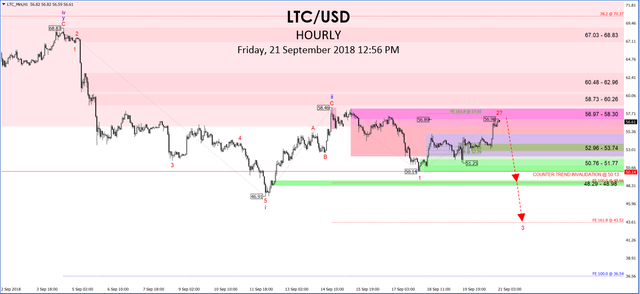
Like BTC, LTC is currently testing the upper band of recent price movements. If this rise is a corrective rebound, which is the favored scenario, then we must see an immediate turnaround to be followed by a collapse below $46.91.
In both the 4-hourly and hourly time frames, the rise from $46.91 remains mostly a 3-wave affair and can only be treated as a technical correction at this stage.
Of the two possible scenarios mentioned in previous updates, an immediate decline from near the intra-day high of $56.98 would suggest that the correction is over and that a resumption of the long-term downtrend is resuming.
The other possible scenario is an extended run towards the supply zone at $60.48 - $62.96. From there, the resumption of the long-term decline may begin. These are the preferred bearish outlooks.
A more bullish version of this bearish view is that the rise from $46.91 is incomplete and may ultimately extend towards the supply zone at $67.03 - $68.83 before turning around. For the time being, this alternate bullish view is not considered unless $58.46 is taken out.
TRADE IDEAS