13th November 2018 Daily Trading Commentary | BITCOIN | ETHEREUM | LITECOIN
 Tuesday | 13th November 2018
Good Day all my beloved students & steemians. Inside this daily commentary I will share the short-term technical outlook and trade ideas for Bitcoin, Ethereum and Litecoin.
 Previous commentary refer here: http://bit.ly/btcethltc121118
 My core strategies refer here: http://bit.ly/taicorestrategies
 WARNING
Do not attempt to use any of the trade ideas contained within unless you have attended my classes and understood the risk and money management behind these ideas.
 Full Disclaimer refer here: http://bit.ly/tai-disclaimer

Want to own Bitcoin rather than ETF trading, check the two link below:
 Honey Miner : https://honeyminer.com/referred/59hvc
 CryptoTab : https://get.cryptobrowser.site/2402149
 You can also follow my FITS:
Facebook - http://bit.ly/danielang_fbpg
Instagram - http://bit.ly/danielang_ig
Twitter - http://bit.ly/danielang_twitter
Steemit - http://bit.ly/danielang_steemit
BTC/USD
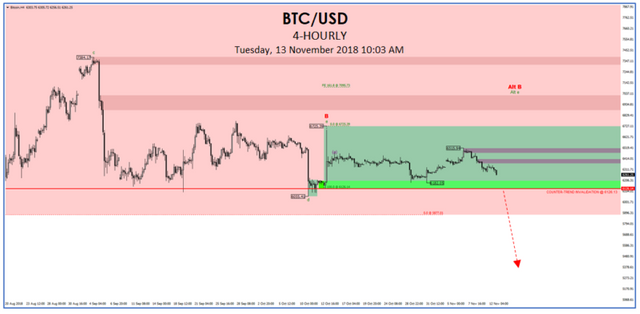
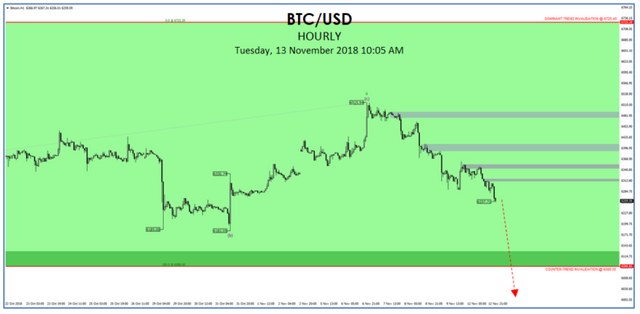
Crypto assets continue to retreat from last week’s highs, and at this rate, there is a chance the long-term decline may resume. In BTC, the drop from last week’s high of $6515.94 may be gaining momentum especially if the current deterioration results in a break below $6088.50.
That said, allowance is for another rally attempt the $6835 - $7020 bracket. This is to allow the odds that the wave B rebound is incomplete. But, overall, the fact that the dominant trend in all time frames are down favoured the downside and the resumption of the long-term downtrend.
This anticipated fall is likely the last leg of the year-long decline in crypto assets.
 TRADE IDEAS

ETH/USD
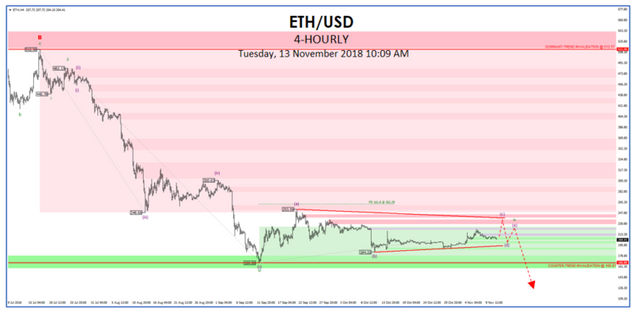
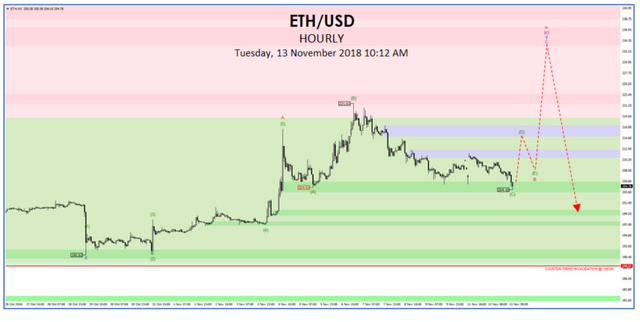
As noted previously, the price structure in ETH is a little more complicated compared to BTC. Based on its price actions, it appears the triangle pattern is still unfolding.
In this case, we could see a rally attempt to perhaps the $215 - $217 bracket before the triangle pattern is complete. If so, the resulting post-triangle thrust may see a sharp fall to below the year’s low of $166.88. A sustained break below $188.40 would confirm this bearish view.
TRADE IDEAS
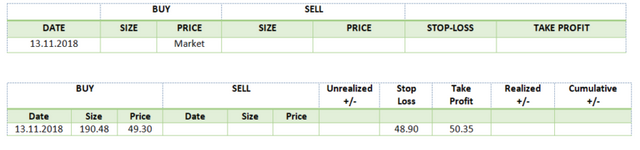
LTC/USD
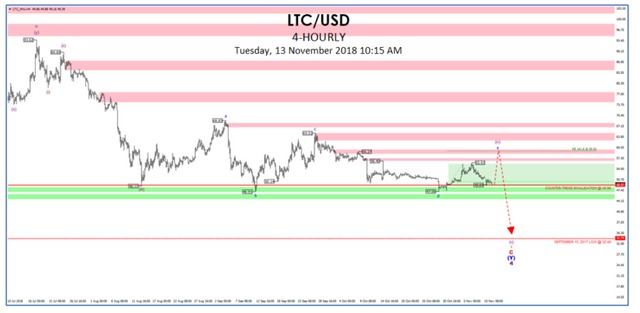
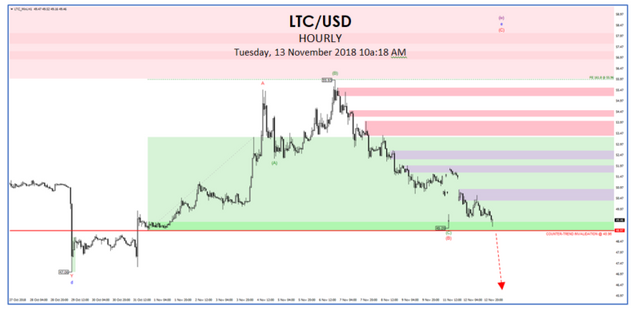
LTC is at a crossroad now. A break below $48.96 would all but confirm that the long-term downtrend has resumed. On the flip side, current price within the demand zone at $48.97 - $49.39 offers an excellent low-risk trade setup.
With the risk located at just below $48.96, if this trade setup works out, a counter-trend long position may yield a rally towards $50.36 - $50.87.
Based on the current price of $49.30, that a risk/reward of 1:2.65. Not bad for a scalping trade. In the event, if $48.96 is taken out, the resulting fall may challenge the September 15, 2017 low of $32.48. But be warned, if and when LTC trades below $40.00, it will become attractive again to buyers, and it is likely LTC may bottom out somewhere between $32.48 - $ 35.50.
TRADE IDEAS