BITCOIN - 8/4/2017 Price Update
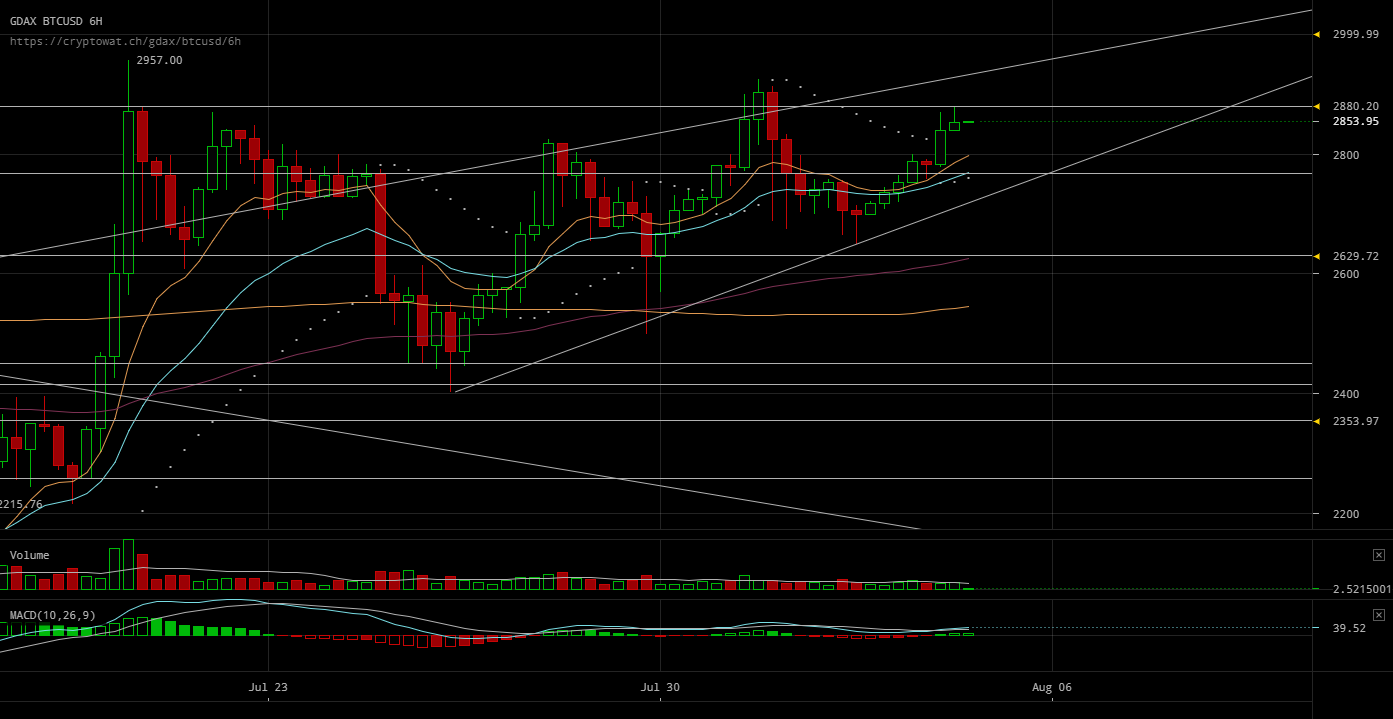
Good afternoon! After consulting my charts and adding trend lines, I have noticed a rising wedge pattern forming.
The top of the pattern is formed from the bottom of the symmetrical triangle's trend line while the bottom is made from July 26th's testing of the 20th's breakout level. If this pattern is correct, this usually denotes a reversal.
I see this pattern potentially playing out in one of two ways:
We have already failed at $2880 which is the nearest level of resistance for the current price. We could potentially break above it and break down out of the channel sometime shortly thereafter.
As the price currently drops after the failure at $2880, we fall out of the channel sometime in the next 2-3 days. This will mark a huge double top (June 11th's high and the failures at $2880 since July 19th). From there we could move substantially lower.
My suggestion is to sit tight and see how this wedge pattern plays out. However, if we break above $2880 and reach about $2937 then we could go higher from there. I have been mentioning adding to longs since yesterday which would have made you $100 but at the moment I'm concerned about failure at $2880. At this point do nothing and let the pattern (potentially) play out. If it is indeed a rising wedge, then you will sell before any meaningful price downturn, and if it doesn't, then you have bought in for the next bull run.

