How Much Lower Is Bitcoin going?
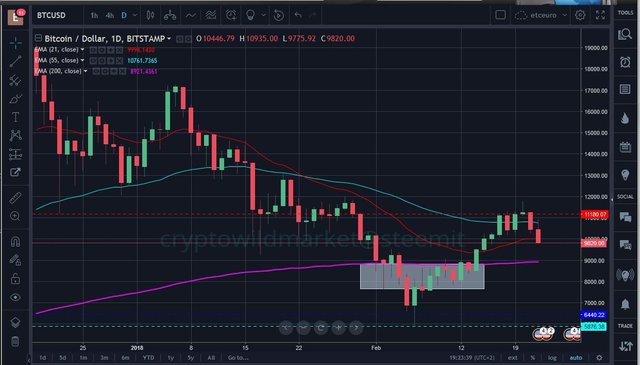
22 Febuary 2018 Bitcoin/USD Day Chart with Tradingview.com
I have been successfully trading in the Forex Currency markets from 2007 and also adopted small positions in different time periods starting in Bitcoin back in 2009. I hold other positions in cryptos and based on my research I have built a nice portfolio of cryptos which are all in the top 20 now and even with the corrected price Im still in profit because I got in at the right price points.
Moving onto Bitcoin.....
Looking at the first chart, three weeks ago I based on my assumptions and interpretations on the fundamentals of the market sentiment that BTC price is possibly going much lower and I will explain why NOT just charts but research and knowledge of how markets work.
On the chart I drew the box (white box) around a price area and approx time line of 14 days.
We can see that the 200EMA (purple line) has attracted and held BTC price to flirt above and below.
I use the 200EMA as what the market calls a fair price level, the Red line is a 21EMA and the Blue a 55EMA.
Price touched a low of around $5876 USD marked with a blue dashed line.
The Red dashed line if you observe price is my averaged out price level that I plotted from a weekly chart.
At the moment BTC is making its mind up or should I say market participants are keeping it inside the area between the price of $11180USD and about the $6000USD.
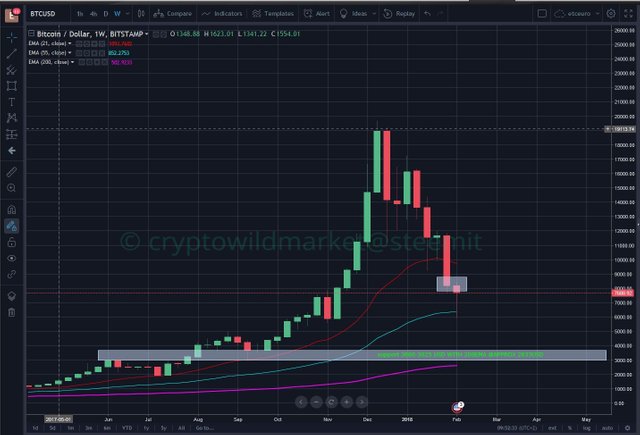
Be prepared for BTC price to begin a test of the lower price area shown of the Weekly chart below and look where fair price is indicated by the 200EMA.
On the Weekly Chart the 200EMA comes in around the $2633USD price level, why? I will reveal my analysis and assumptions.
Stay tuned more to come.....

