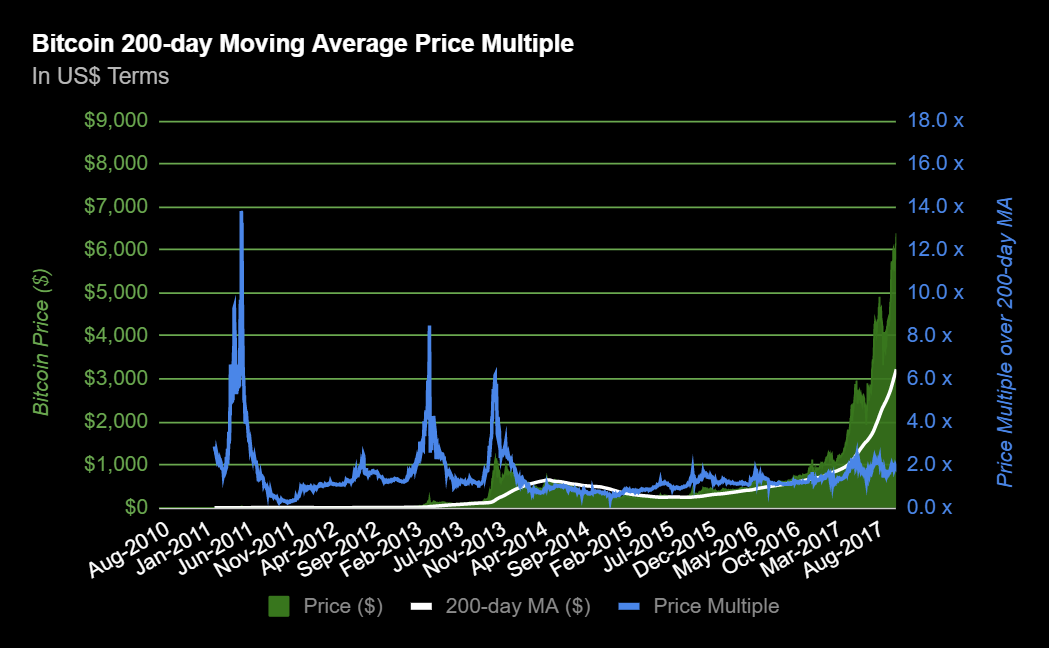
Chart 16: Bitcoin 200-day Moving Average Price Multiple
Filtering out noise on Bitcoin. Long-scale view, taking the daily price, divided by its 200-day moving average on that day. The resulting multiple gives you a long-term trend on value. If the multiple is well over 1x, Bitcoin could be overvalued. If the multiple is well under 1x, Bitcoin could be undervalued. Bitcoin is currently trading around 2x the 200DMA. This ratio is quite moderate compared to prior booms. Notice the 3 big ones in 2011 and 2013!!
This is a great article. Now I've got to figure out today's 200 day MA
Have you figured out a good way to chart today's 200 day average?