Bitcoin Cash Update - ( BCH ) Price Pathway Using Elliot Wave Counting + Chart Patterns. Blog#3
After taking a look at this chart on a 15minute time frame I noticed a symmetrical triangle ending on a downward (E) meaning a bullish trend is taking place.
this triangle I think is the correction from the previous 5 wave impulse.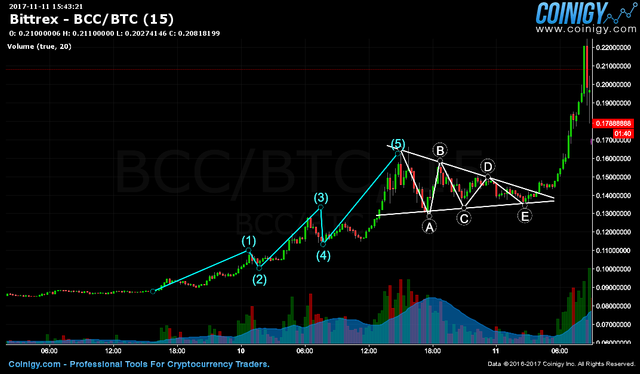
NEXT
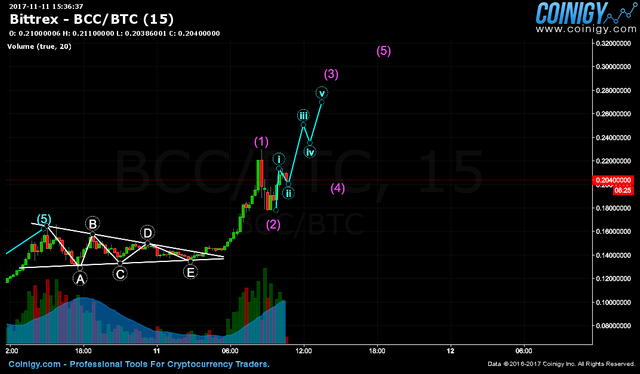
I think an Impulse has started and with the first 2/5 waves placed.... I have charted out the rest below.
IF YOU LIKE THIS PLEASE UPVOTE AND COMMENT HOW YOU THINK I HAVE DONE as well as any input or requests you may have. I am in the very early stages of learning T.A. and I would love to give any request a try.
Thanks!
WARNING!! This is only my opinion, make of it what you wish. What does this mean? It means it's not advice nor recommendation to either buy or sell anything! It's only meant for use as informative or entertainment purposes.

Nice one! Make sure purple 4 doesn't overlap with peak of purple 1
ohhh Okay i shoudlve seen that. Thank you for correcting that
@originalworks
The @OriginalWorks bot has determined this post by @cryptosuf to be original material and upvoted(1.5%) it!
To call @OriginalWorks, simply reply to any post with @originalworks or !originalworks in your message!