Bitcoin (BTC) Update: Imminent Breakout? Bull flag confirmed for the 5th time in a row!!!!!

The white bars indicate the crossing of moving averages... when it happens at the moment the candle is above the "water" (emerged), we call this event 'emerged crossing' and it represents a bull flag.
This is part of our method called ‘water crossing’ that has proven to be efficient over a long time. In this case, the bull flag was confirmed for the 5th time in a row!!!!! Proving that it's not coincidence, showing the power of technical analysis and our method!

CryptosRocket setup shows us different scales at the same time. The 1-day (1D) candle chart is the main one for bitcoin in the water-crossing method, but we also use 1-5 minute candles to set the exact time for our jumps in and out.

RSI: After 5 impulse waves we are closer to overvalued levels than the opposite, so a small correction is perfectly normal and expected.

Stochastic RSI: We are in overvalued levels here, helping the bears in short-term.

Stochastic: Overvalued levels... This only strengthens the Stochastic RSI indicator.

MACD: Considerable distance between blue and red lines... small dip in the short-term is likely, but the upward triangle shape is very bullish, showing that bears are losing strength in the medium to long run.
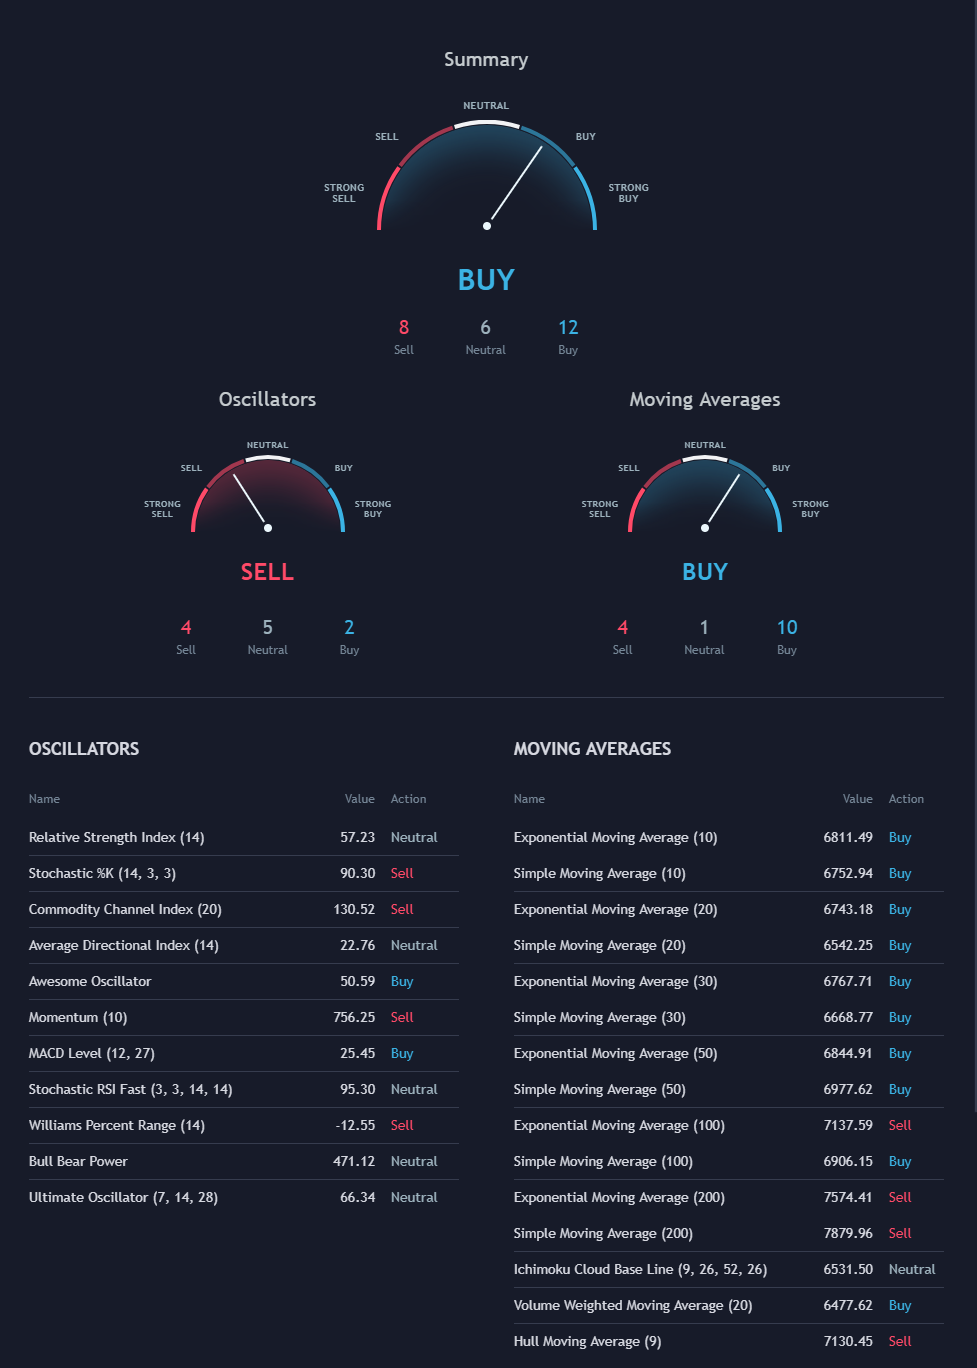
Below is the recommendation based on the combination of more than 25 indicators (when applicable) for different time frames.


Conclusion: Despite the bearish scenario in short term, the forecast for medium-long term is quite bullish even if a breakout does not occur (dashed line - first chart). If we decisively break it, so we can easily go to ~7.4k. A submerged crossing should indicate soon the confirmation for a dip (we'll let you know when it happens)... and a not so far new emerged crossing should anticipate the start of the next impulse waves sequence!

DISCLAIMER: None of CryptosRocket content is investment or financial advice. Please do your own research before investing and invest at your own risk. Do not invest more than you can afford to lose and consult a financial advisor if necessary.