Hi Steemers!! My name Is Carlos and I love sharing my charts and enjoy educating those willing to absorb! I hope to provide some cryptosolutions in trading!
I will be posting my daily chart analysis. I keep it very simple when it comes to trading. I use a trade plan and stick to it!
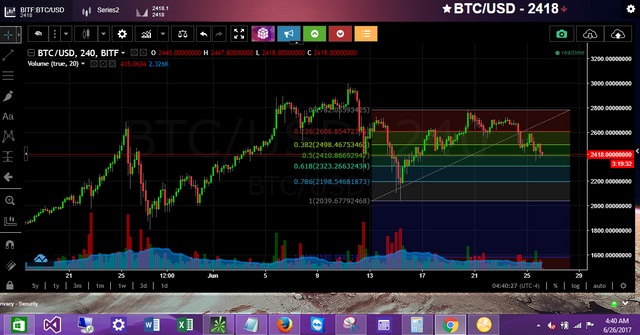
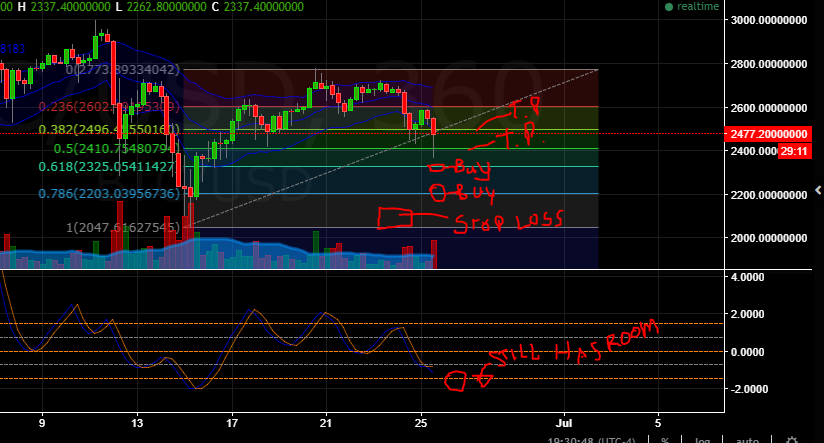
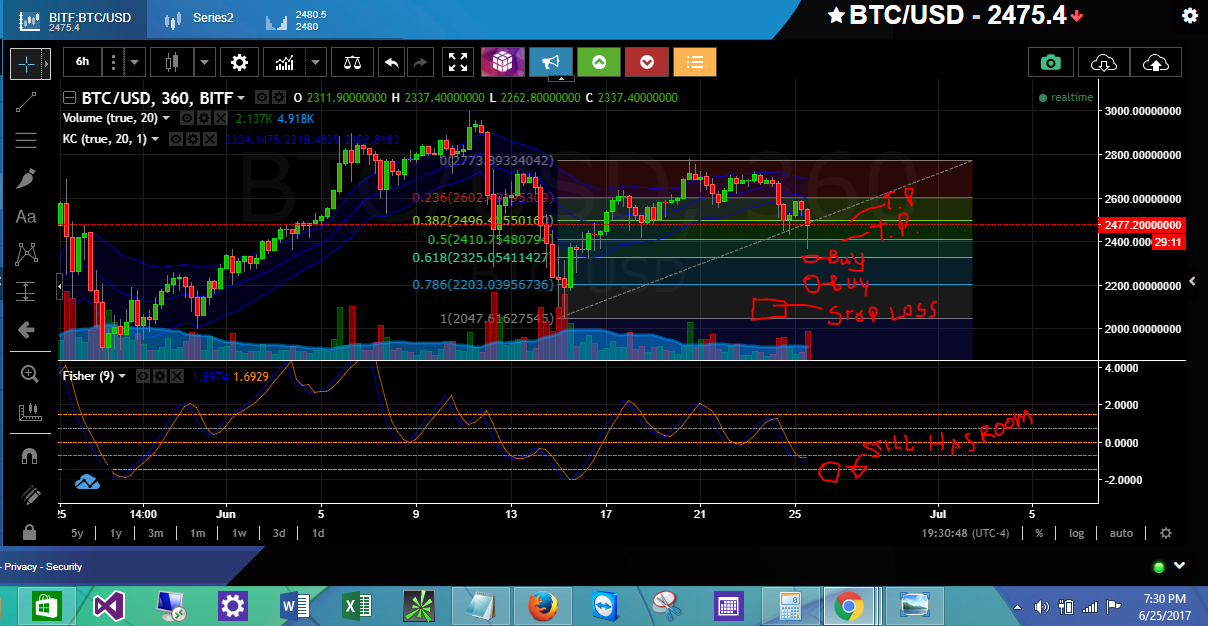
I use multi time frame analysis following the trend for opportunities in a trending or countertrend instrument. I use keltner channels, Fisher Transformers, trend lines/channels, support/resistance, Value area and Fibonacci (the Golden ratio).. I wait until the trade comes to me. I never chase a trade! My trade analysis lets me know where to take profits and set stop losses before I enter a trade. I check to see if the instrument that I am analyzing is running technical.. Meaning : it's hitting my Fibonacci's to the tick.. Then I check for convergence in the time frames: weekly, 6 hr, 4 hr all the way down to the one minute chart.. If all the stars align.. ( convergence ) I'm in the trade . I look for 60 to 70 % reversal probabilities and get in following trend or get in if I see a counter trend opportunity (countertrend trades are more risky) So I will let you know if it's a counter trend trade or not . I look forward to helping anyone out on simple chart analysis and i'm open to your questions and analysis of my charts! Please send me your charts as well ! Here is my analysis for a counter trend that i'm currently watching in BTC/USD. I'm also open to analyze any charts you would like me too. Just let me know.!
Risk Disclaimer
Futures, options, and binary options trading have large potential rewards, but also large potential risk. You must be aware of the risks and be willing to accept them in order to invest in the futures, foreign exchange and options markets. Don't trade with money you can't afford to lose. This website is neither a solicitation nor an offer to Buy/Sell futures, spot forex, cfd's, options or other financial products. No representation is being made that any account will or is likely to achieve profits or losses similar to those discussed in any material on this website. The past performance of any trading system or methodology is not necessarily indicative of future results.
Hey there.. Thats nice! I personally trade raw orice action, without any indicators and tools such as fib or supp and resistance lines.. only candles and market psychology..
But reading from other traders is always cool.
Keep up the good work :)
Thank you Amy ..
How do you determine you entry and exit point?
Raw price action... candles tell you everything.. you should look into candles .
They lietrally tell you whats going on at the moment of the candle being pasted/formed and the previous candles tell you what happened in the market, and why.
it's interesting stuff.
almost there.
(html comment removed: copy and paste. Modify height and width if desired. )