Bitcoin, Ethereum, Ripple in Green, IOTA Day’s Leader: Price Analysis, June 1
EOS loses a little, IOTA grows, cryptocurrencies across the board are being in green

All the major cryptos from the top 20 are in a positive mood on Friday, but in general, there is no clear tendency currently as fluctuations are neutral. Cryptocurrencies seem to stop or to pause (which sounds better here) their downtrend for a while. However, what we see now on the charts looks like a correction and not a reversal.
The fundamental background is neutral in the moment of writing as there are no news to affect the industry significantly. However, some interesting facts we have gathered here. Despite the fact that almost all cryptos are green, EOS looks weak as Qihoo 360 has found security problems that lead to some losses. However, EOS still holds its positions generally as the system will transfer to mainnet on June 2, 2018.
As for the general picture, cryptocurrencies still need some good news to start the uptrend. They remain neutral and seem to be in correction to the previous downtrend.
Bitcoin (BTC/USD) Price Analysis, June 1
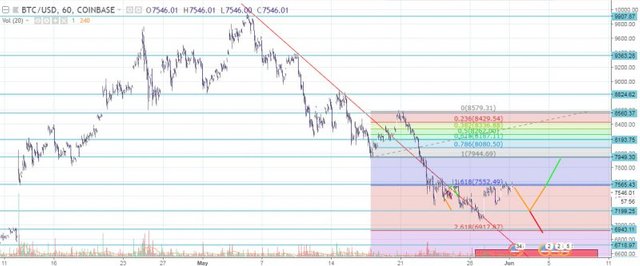
The currency pair started a correction this week and added around one percent on Friday. BTC/USD has jumped over the descending trend line and moved higher meaning bulls have finally found their support point.
Let’s have a closer look at the current situation within the Fibo retracement graphic tool. The currency pair still tests 1.618 retracement level, which coincides with the $7,565 resistance area. It stays within a horizontal channel with no clear direction. However, we have lower lows meaning the currency pair forms a kind of an ascending triangle, which is able to burst upwards. The possible ways for BTC/USD are the following:
Red scenario (bearish). The currency pair will move towards the closest support area at $7,199 to test it. If successful, sellers will be able to push BTC/USD even lower.
Orange scenario (neutral). BTC/USD will move towards the closest support at $7,199 to test this line. However, bears will be unable to penetrate through this area and will retreat as BTC price will go upwards targeting the closest resistance area at $7,565.
Green scenario (bullish). Bitcoin will jump over $7,565 and run higher targeting one retracement level, which coincides with the $7,949 resistance area.
Ethereum (ETH/USD) Price Analysis, June 1
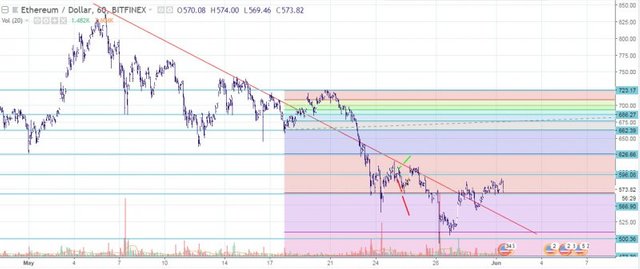
Ethereum has added nearly two percent in the past 24 hours. However, the situation currently is still far from being positive as ETH price has difficulties to grow. ETH/USD is above the descending trend line currently meaning buyers have a chance to change the game.
Let’s zoom a bit to the Fibo retracement tool. ETH price shows low volatility today. It is close to the support area at $566.90. ETH/USD has broken through the descending trend line on Wednesday. Ethereum makes attempts to run higher since but still needs more power. What are the possible ways for ETH/USD?
Red scenario (bearish). ETH/USD will break through the current support area at $566.90 and move lower targeting the next support area at 3.618 retracement level.
Orange scenario (neutral). Ethereum will jump off the current support area at $566.90 and move higher towards the next resistance area at $596.08. ETH/USD will reverse there to move lower (flat fluctuations).
Green scenario (bullish). The currency pair will reach $596.08 resistance area and move higher towards $626.66 resistance area, which coincides with 1.618 retracement level.
Ripple (XRP/USD) Price Analysis, June 1
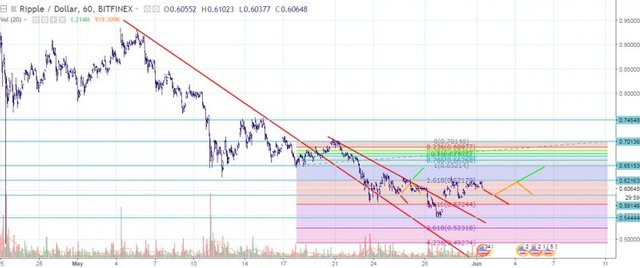
The currency pair added nearly one percent in the past 24 hours. The volatility is low and there are no drivers currently to affect XRP price significantly. However, XRP price is above two descending trend lines (midterm and short-term) meaning chances for the price to rise are higher.
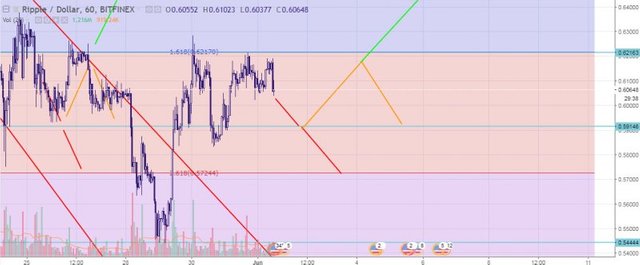
Ripple has reached the resistance area at $0.6216, which coincides with 1.618 retracement level. There were several tests, but bulls were unable to cross this line. The price jumped off $0.6216 again and moves towards the closest support area at $0.5914 in the moment of writing. What are the possible ways for ETH/USD?
Red scenario (bearish). Ripple will reach the closest support area at $0.5914 and cross it targeting the next support at 2.618 retracement level.
Orange scenario (neutral). The currency pair will jump off the closest support area at $0.5914 and mover higher towards 1.618 retracement level, which coincides with $0.6216 resistance area. There, XRP price will reverse again to run lower (meaning flat channel trading).
Green scenario (bullish). The currency pair will reach the closest support area at $0.5914 (or start from the current levels) and then will reverse upwards targeting $0.6216 and the next resistance area at $0.6515.
Take a look at EOS (EOS/USD) and IOTA (IOTA/USD) Price Analysis, June 1 HERE
Coins mentioned in post:
Hi, thank you for contributing to Steemit!
I upvoted and followed you; follow back and we can help each other succeed :)
P.S.: My Recent Post
Already followed you