Bitcoin, Ethereum, EOS Return to Upside Correction: Price Analysis, June 6
Holy Top 20 is in green Wednesday, technical factors rule the markets

Holy Top 20 is in green Wednesday, technical factors rule the markets
The Holy Top 20 is green Wednesday (except Lisk naturally, which has shown the negative dynamics in the past 24 hours), which means that cryptocurrencies have returned to their correction paths. Is there something important to make investors and traders change their bearish moods? Obviously, nothing to pay attention to.
This correction is a technical aspect that has no fundamental basis currently. However, nobody is able to predict whether there will be no reasons for growth tomorrow. Anyway, those who have already bought cryptos in the beginning of their corrections are happy now as cryptocurrencies have deeper corrections than initially expected.
As for news, there is nothing to affect the industry, but we would like to mention Steve Wozniak’s interview, in which he stated that Bitcoin will become the global crypto in 10 years.
Bitcoin (BTC/USD) Price Analysis, June 6

Bitcoin continues its correction to the downtrend, which generally looks like wide flat fluctuations. BTC/USD has added almost two percent in the past 24 hours. However, Bitcoin remains under the green ascending trend line, meaning the correction momentum is lost already.

Let’s get closer to the current situation. BTC/USD has reached the support area at $7,341 on Tuesday, but jumped off this level later and managed even to cross the closest resistance area at $7,565. The currency pair has tested the green ascending trend line from below, but buyers were unable to drive Bitcoin higher. The possible ways for BTC/USD are the following:
Red scenario (bearish). The currency pair will break through the closest support area at $7,565 and move lower targeting the next support area at $7,341.
Orange scenario (neutral). Bitcoin will stay within the range, limited by the resistance area at $7,734 and the support area at $7,565 without significant price changes.
Green scenario (bullish). BTC/USD will move towards the closest resistance area at $7,734 and break it through targeting the next resistance area at $7,949. This scenario includes also the probability for Bitcoin to jump over the green ascending trend line.
Ethereum (ETH/USD) Price Analysis, June 6

Ethereum has added almost two percent in the past 24 hours but ETH price is still below the green ascending trend line. The situation looks like ETH/USD is in correction in general, but the latest fluctuations show that the currency pair is in a large flat with no clear direction.

Let’s see closer what is happening inside the Fibonacci retracement. ETH/USD has reached 2.618 retracement level on Tuesday but failed to hold it as ETH price went upwards. Ethereum has crossed the closest resistance area at $596.09 later. The currency pair stays above this level currently, below the ascending trend line. What are the possible ways for Ethereum?
Red scenario (bearish). The currency pair will break through the closest support area at $596.08 and run lower targeting the next support area at $566.90.
Orange scenario (neutral). ETH/USD Will stay within the current horizontal range, limited by the resistance area at $626.66 and the support area at $596.08 without any significant changes.
Green scenario (bullish). The currency pair will break through $626.66 resistance area targeting the next one at $662.39. This scenario includes also situation when ETH/USD jumps over the ascending trend line.
Ripple (XRP/USD) Price Analysis, June 6

Ripple looks better than allies as the currency pair develops its upside correction. It is close to the boundary of Fibonacci retracement tool and may breach it in the nearest future. However, XRP/USD still stays below the green ascending trend line.
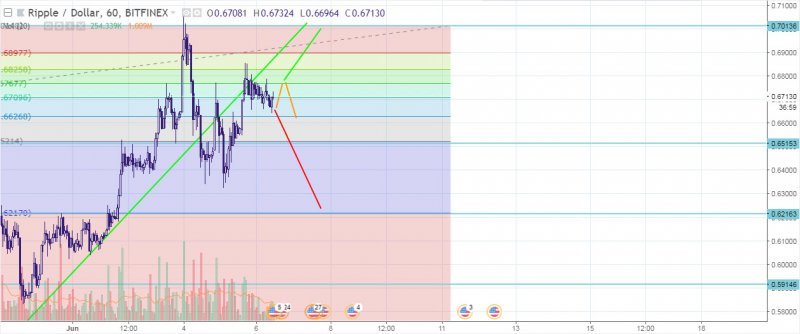
Let’s have a closer look at what’s happening on the hourly chart. The currency pair had a deep downside correction on Monday and Tuesday but managed to cross $0.6515 and several retracement levels. XRP/USD failed to jump over the green ascending trend line, but was close to it. Ripple seem to establish a bullish flag currently meaning the currency pair will be able to develop its upside tendency. What are the possible ways for XRP/USD?
Red scenario (bearish). The currency pair will cross 0.786 retracement level and the support area at $0.6515, which coincides with one retracement level targeting the next support area at $0.6216.
Orange scenario (neutral). The currency pair will stay between 0.5 and 0.786 retracement levels without significant price changes.
Green scenario (bullish). XRP/USD will develop its upside tendency targeting the upper boundary of the Fibonacci retracement, which coincides with the resistance area at $0.7013.
Take a look at EOS (EOS/USD) and NEO (NEO/USD) Price Analysis, June 6
Get your post resteemed to 72,000 followers. Go here https://steemit.com/@a-a-a
Waiting for that 4Hour close above $7,700 before taking a trade.
💪👍