Bitcoin- Bad Signs, EOS Looks Good, ETH is On the Edge: Crypto Price Analysis Update, Sept. 10, 2018

Bitcoin - bad signs come from the weekly candle close
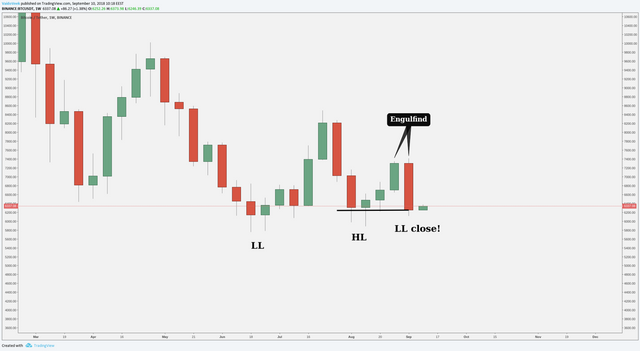
We are again in a well-known area between the $6,000-$6,500 where the big guys don’t even hide their movements. Just a quick sell off and the next day a quick buyback and etc.
Bad signs come from the weekly candle, the previous week close was below the $6,500 mark, below the April low and below the strong support area, which all indicates that there is a very big selling pressure. The previous week’s close (bearish “Engulfing” candlestick pattern) gave us another lower low close and again, the overall market structure is bearish.
Currently, BTC price moves in the down channel and it has broken support after support. This channel guides us exactly into the $6,000 range where there is a major counter trendline, pulled from the June 24th low and from the Aug. 14’s low. So, if it drops, then this is the first target that we have to watch where we want to search and predict any further moves.
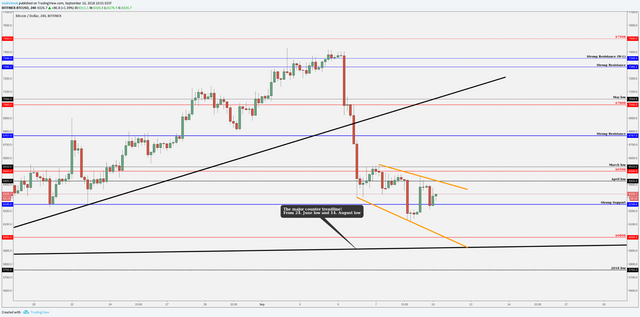
Currently, trading is definitely very risky because we don't have any significant confirmations. Confirmations are only bearish and come from the weekly chart but if you want to know when we could see a bit better opportunity to enter the market or any altcoins then it would be a four-hour candle close above the 'yellow' short-term trendline, above the April low and above the round number $6,500. There we can say that the short-term trend could be bullish and remember the counter-trend is always very risky because we have bad signs from higher time frames.
EOS (EOS/USD) shows some strength
Over the weekend when almost all alts took another hit, EOS holds the price very nicely.
It shows that EOS has some potential and the platform is technically solid.
The weekly candle closes below the round number $5 and below the short-term counter trendline but nothing significant just a small fall and quickly back around the $5 area.
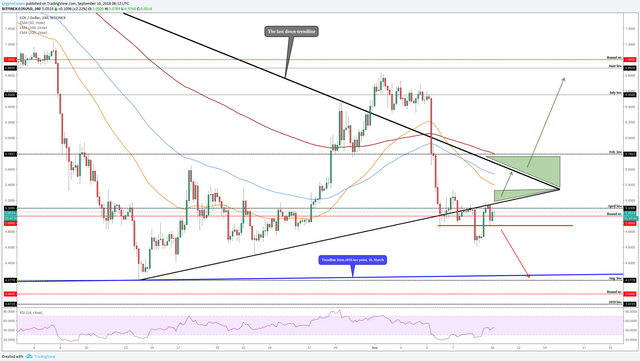
Currently, we trade above the round number and on lower time frames. We could see that it starts to form a bullish chart pattern called "Inverted Head & Shoulders" which will indicate the further move upwards.
If we want to see a bullish move then we have to get a close above the April low and a candle close above the counter trendline. This will guide us to the last down-trendline which starts to work as a resistance if we take down the last down-trendline then we have a free “road” almost to the $6.5-$7.
A bearish move will be almost confirmed when it gets a close below the red line and then the price will continue the move down on the down channel. Nearest supports would be the trendline which is pulled from the 2018 low point, the August low and the round number $4. This zone is a very strong area and we expect further price movement from this price level at $4-$4.2.
Technically, EOS looks very strong and promising if the market finds the way upwards.
Take a look at ETH (ETH/USD) Price Analysis, Sept. 10, 2018
Have a nice day!
Resteemed your article. This article was resteemed because you are part of the New Steemians project. You can learn more about it here: https://steemit.com/introduceyourself/@gaman/new-steemians-project-launch