BTC - Bounce confirmed from our Support Line
Hello all,
Here was the chart of yesterday :

Here is the current chart :

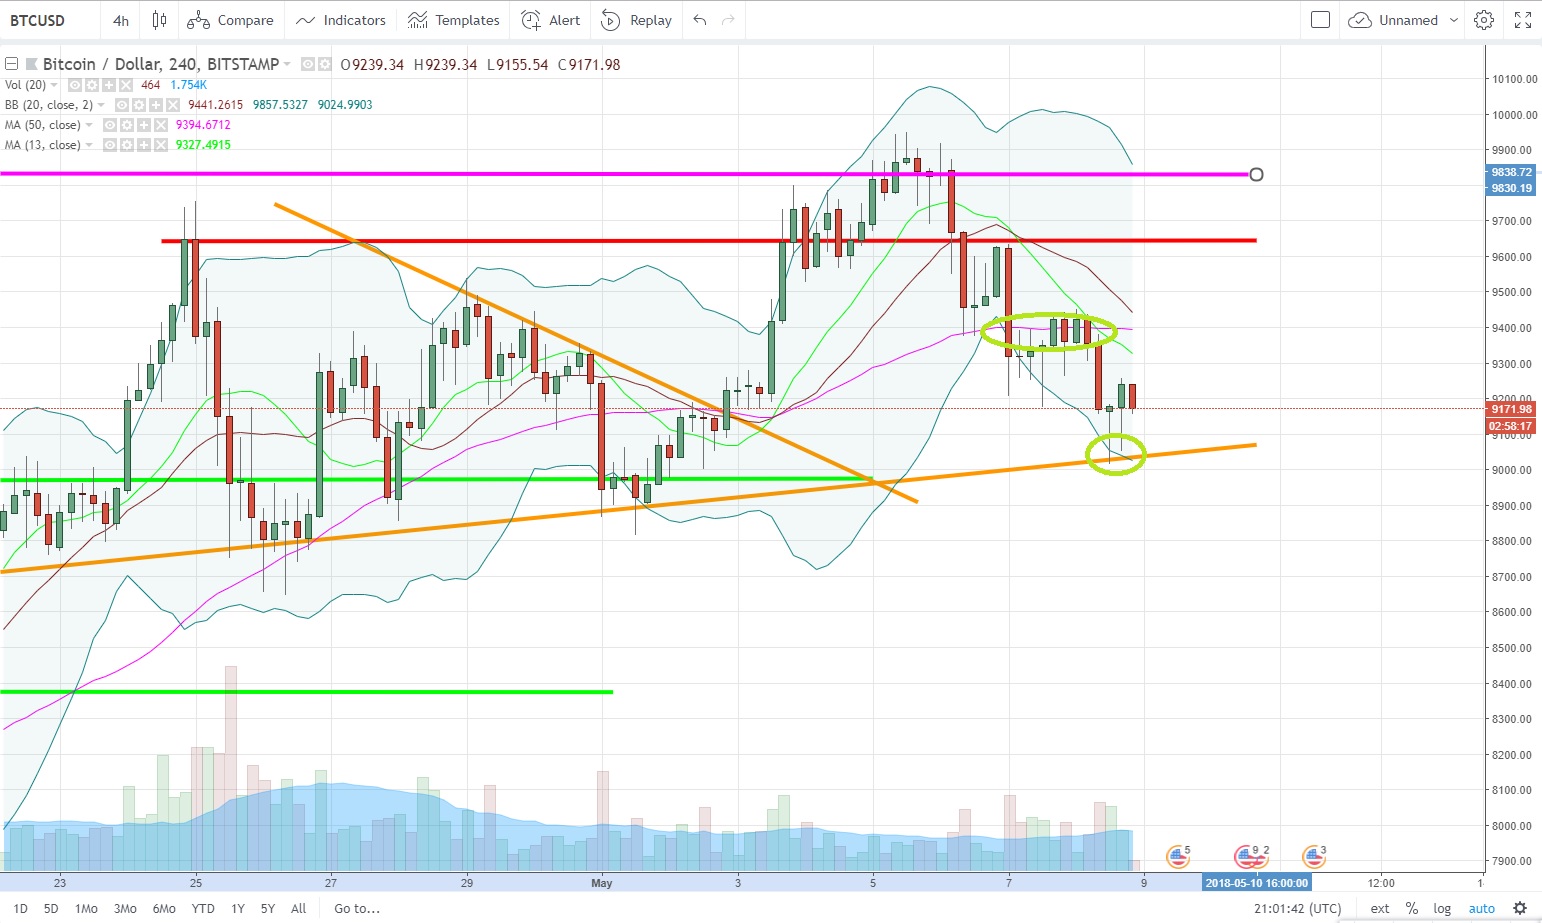
We can see clearly that our support line created by the down line of the previous triangle is playing well its role. We had a nice big bounce candle after several tests and we are now approaching one my favorites MMA, the MMA50 in violet.
We need to break that line to change the current short term trend. If we are not able to break soon that MMA50, we will go again test our support line in orange and perhaps finish to break it. So let's hope that we are able to go over that MMA50. If it is the case, the direct objective will be the resistance line in red around 9650$.
I wish you massive profits,
Cryptopassion.io
Disclaimer : Never invest more than what you can afford to lose. This post is my personal opinion, do your own research before making any investment decisions. If you make any trades after reading this post, it is completely in your responsibility. I am not responsible for any of your losses. By reading this post you acknowledge and accept that.

With my daily exchanges of cryptos, I can recommend you the platform Binance

Do you want them spendable directly via a dedicate Visa card ?
You prefer a quick transfer on your bank account ?
I can recommend you the platform Wirex


why yellow line is support
The yellow line is a trend line. You draw trend lines connecting two or three lows and project the line in the future. You can also connect highs. In this case, some lows where connected. Technical Analysis states trend lines connecting lows can act as a support keeping price from going down. And trend lines connecting highs can act as a resistance keeping the price from going up.
I know what a trendline is, with what probability can it be broken?
That is the million dollar question!
As a general rule, all you can tell is the more times a trend line is touched, the more probabilities it has to be broken.
Just Bounce!...
Thanks @cryptopassion.
Great analysis... As always!
When we break 10k support we only stop at a new all time high.
We just need to break the 10000 barrier for things to pick back up!
thank you for this analysis and the update!
If I can give you guys my opinion for a good ICO, I discovered an exciting one: RAWG. If you want to have a look and get some information, the ICO will start by the end of the month.
The ICO site is this one: https://token.rawg.io/.
It's a video game discovery platform that converts your skills into goods and services.
You can earn tokens by playing your favorite games. The site is already working, with more than 50,000 games in the database and new games are getting added every day. This is the site: https://rawg.io/
Quite good looking, don't you think?
Have a look. I hope this information is helpful.
Hello! Good article! I'm interested in the them of ICO and crypto-currency, I'll subscribe to your channel. I hope you will also like my content and reviews of the most profitable bounties and ICO, subscribe to me @toni.crypto
https://steemit.com/blog/@dramaqueen077/sad-lyrics-about-mother-and-daughter
vote for vote please
Good Thank you for this analysis and the update!
It was a clear morning doji star on the 4hr chart.
https://discord.gg/Upr39TF