No Meows For This Cat - BTC/USD 24th Feb 2018 11.30 UTC Chart Analysis
They say that even a dead cat will bounce if it falls far enough, and while it might be a touch harsh to compare the inimitable BTC with a dead cat, its performance, as predicted by the previous Cryptonym post, has been less than the 'stellar' rating that most chart 'analysts' seem to unendingly dig up for it. It seems as if some of these analysts just draw whichever lines they'd like to see to keep their long positions in the green, instead of reading what is actually likely to happen from the chart. Maybe they should learn how to short a falling stock!
In the previous post, I predicted that the only high probability play indicated by the chart as of mid - week and leading into the weekend was to short from the price at the time, around $10,800, to the low $10,000 or even $9499 range. As of 06.00 UTC today, my signals were proven correct, with the price action having dipped down to $9505 (fig.1):
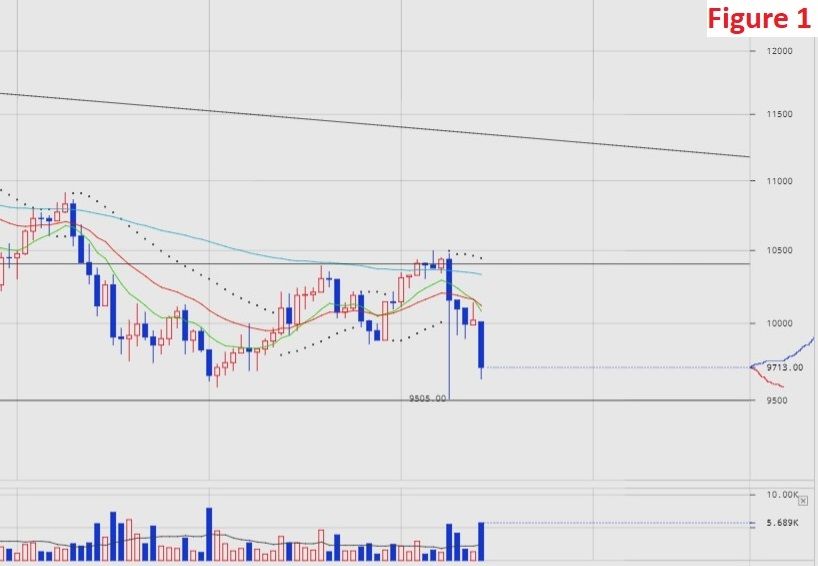
Interestingly, this new short term low comes after a pull back rally that started at 00.00 UTC on Feb 23rd and appears to have been the result of the desperate support that was seen on the level 2 action in the late hours of Feb 22nd - large block buy orders frantically trying to prevent a technical breakdown below the crucial support level of $9499. I guess the global network of trading computers (Skynet?) knew what would naturally come next - a high volume breakdown that could threaten the $6000 mark.
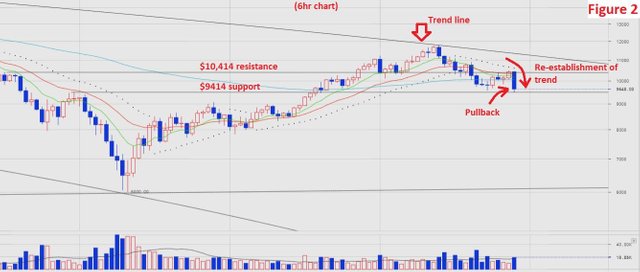
This raises an interesting point; the general trajectory of a chart tends to prevail over shorter term pull backs that naturally happen as that trajectory plays out. BTC has been falling ever since it hit the resistance level presented by the long term trend line at $11,788 (see previous posts) and has broken multiple psychological and real support levels, including $11,000, $10,860 and $10,000 in a matter of days. The pull back rally was inevitable, but showed it was bluffing as soon as it conceded to be hemmed in by the resistance level at around $10,414, indicating that it was not a true breakout. The current price is ranging from this resistance level to the support level at $9499. How many tests that support level can maintain without failing is yet to be seen. But I spy a crack in the wall.
(fig.2):
Possible Plays:
Buy now
- nope!
Short now
- Motivation: falling price may test support at $9499 again over the coming hours
- Likelihood: possible/likely
- Current likely outcome: small gain to $9499
- Action: avoid since not enough downside before support level, which could hypothetically hold
Buy later
- Motivation: breakout on high volume past current resistance level of $10,414 and then $11,788
- Likelihood: very unlikely
- Current likely outcome: gain if materialises
- Action: consider if materialises
Short later
- Motivation: breaks through support at $9499 and holds below on high selling volume (ideally > 40K BTC / 12hrs)
- Likelihood: possible/likely
- Current likely outcome: gain
- Action: seek
- Position size: medium/large
- Entry: below $9499 but high enough to have clear downside before $9000
- Exit: likely $9000 initially, could be as low as $6000 if selling volume increases further
- Risk/Stop levels: $9500
Tip of the day: taking risk levels as absolutes in such an extremely volatile currency can cause losses when fake-out breakouts or breakdowns happen. For example, if the price action falls below $9499 in the coming days, it may temporarily spike above this level for a few thirty minute periods or as part of flash spikes, but actually remain on the downtrend. It is worth setting psychological stops and alerts around these risk levels but not being too stringent with the actual values. I recommend giving a 15%-25% leeway and watching how the movements play out. Cut losses early, but not so early that a fake-out ruins your trade.
Cryptonym.
NB.
Values in USD are representative of prices traded on the Bitfinex exchange.
Times are UTC standard.
This does not constitute official investment or trading advice. Your losses are your own.
If you appreciate this work and would like to support Cryptonym, please consider donating:
Steem - via Steemit
Fiat - https://www.patreon.com/CryptonymFund
Bitcoin - 3EYtdz4J7aCsW3wnz64rMvqzmkyBKPahee
Bitcoin Cash - 17VXEM8gRYrms1jtoadoLob5DvBFwWkVug
Litecoin - MQhdRXjojwCwzFLQxtExMKaaYyFZ9ftdB7
Ethereum - 0x46Aa8d31f5d1a7e72b38A13e5E7F9bD5FBC7d8ea
Thank you for the good post! If you interested in Cryptocurrency and the trending news about, you more than welcome to check out my page @iamvishal where I provide daily news on trending topics about Cryptocurrency!
Thanks man, I'll check it out!