Bitcoin Trend Analysis

May 28th, 2018 Bitcoin Trend Analysis
Let's look at the Charts...
Bitcoin on the daily chart...
Bitcoin rolled over at $19k and has been locked in a viscous bear trend since. We see a recent negative bounce taken down from the $10k level. After a quick drop in price, Bitcoin has developed a negative trend heading for its next level of support at $6.5k.
Bitcoin on the 4-hour chart...
Here's a closer look at Bitcoin's attempt to break $10k. The move upward was all started by a huge volume of buy orders pushing the market higher. I smell trading bots...
Bitcoin on the 1-hour chart...
Bitcoin has entered into a bearish channel. We can see it tapering off at the end creating a "tightening" action. As it continues to tighten, Bitcoin will most likely make a large and quick move in either direction. It is impossible to predict whether it will be up or down.
Key Indicators
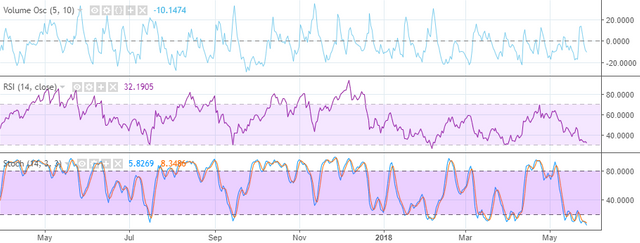
Volume:
The volume oscillator is an indicator that tells us whether we have relatively high or low levels. This can be an indicator for both buy volume and sell volume. Though the oscillator doesn't tell us whether the majority of the volume is from the buyers or sellers, we can infer this by looking at the direction of the underlying asset.
We see here that volume has decreased a large amount since Bitcoin's bull run last year. This tells us that it will be difficult for Bitcoin to change direction in price. It will take a high volume of buyers to give it the momentum it needs.
RSI:
The relative strength index (RSI) is a momentum indicator developed by noted technical analyst Welles Wilder, that compares the magnitude of recent gains and losses over a specified time period to measure speed and change of price movements of a security. It is primarily used to attempt to identify overbought or oversold conditions in the trading of an asset.
Read more: Relative Strength Index (RSI) https://www.investopedia.com/terms/r/rsi.asp#ixzz5Go3P4n3R
Follow us: Investopedia on Facebook
What we see Bitcoin's RSI reaching 30. This signals oversold crypto. In the past Bitcoin has changed direction upon reaching oversold, which is a good sign for the health of the market.
Stochastic:
The stochastic oscillator is a momentum indicator comparing the closing price of a security to the range of its prices over a certain period of time. The sensitivity of the oscillator to market movements is reducible by adjusting that time period or by taking a moving average of the result.
Read more: Stochastic Oscillator https://www.investopedia.com/terms/s/stochasticoscillator.asp#ixzz5Go4FQXzB
Follow us: Investopedia on Facebook
We see Bitcoin's stochastic now below 20 which could signal a change of direction for the crypto market.
Summary
As Bitcoin heads closer to its support at $6500, it may be a good time to start preparing yourself to take a short term position to ride it out for some gains (not financial advise, just what I plan to do). An RSI of 30 and Stochastic of less than 10 could be signaling for a change of direction in price. Yet, I am expecting lower levels over the next few days until we reach $6500.
Thanks for reading...

Disclaimer: I am not a financial advisor. The articles that I write are for educational purposes only. Do your own research and hold yourself accountable for the investments that you choose to make.
Looking for a reliable Bitcoin and cryptocurrency trading platform? Try my link at binance for half off trading fees (only 0.05%)
Here's my link: https://www.binance.com/?ref=13626955
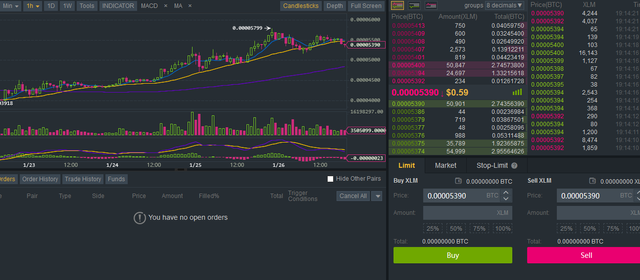
One of the reasons I only use binance to trade is that it has high security and offers a wide selection of cryptocurrency pairs. I only recommend products that I use on a daily basis.
Follow me on social media:


If we don't break $7,600 expecting a sell off. This could potentially be our bottom, if not I think it might fall towards $3,000. Thoughts?
We are already in the midst of a sell off! I could see $3000. I will start purchasing at $4800...