Fascinating Angles Operating On Bitcoin
Bitcoin continues its meteoric rise and although it's difficult to say where prices might find resistance before a much larger correction sets in, I am certainly remaining cautiously optimistic.
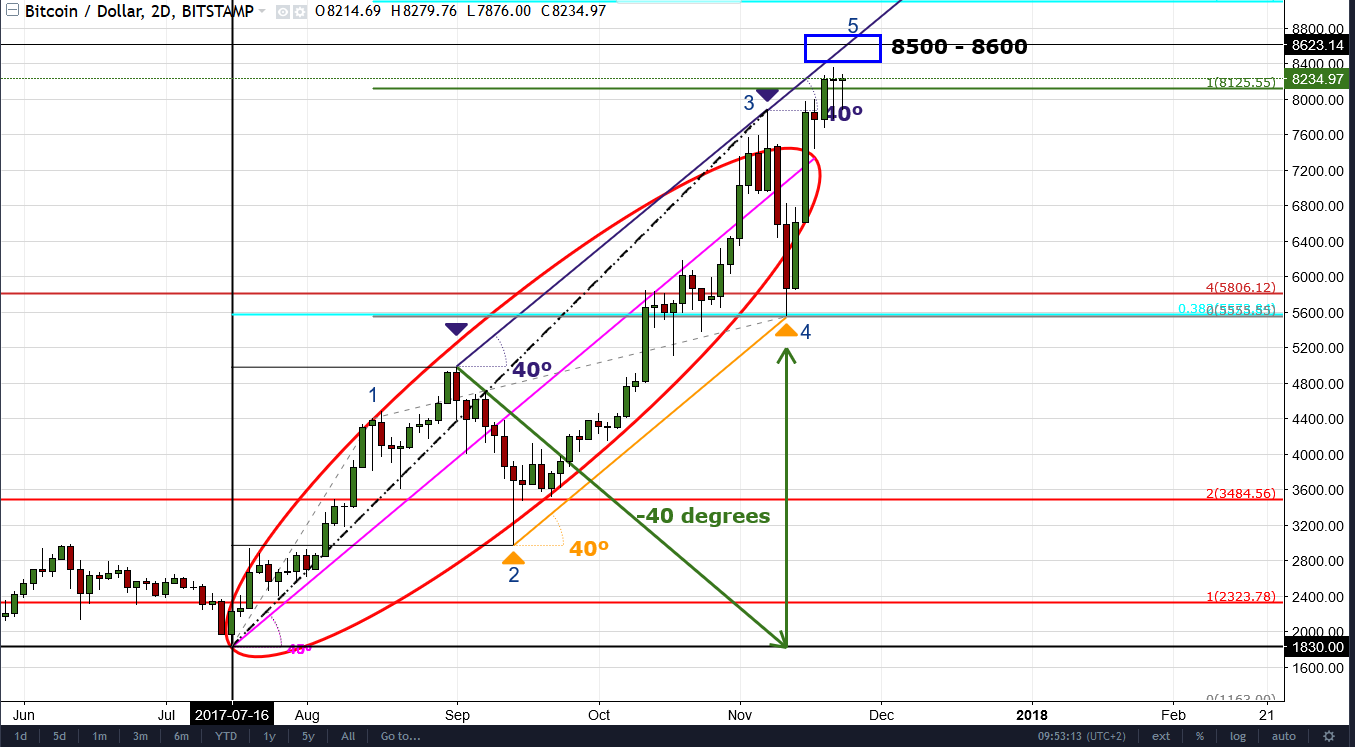
Some basic Gann type technical analysis I have done on Bitcoin recently, shows some very cool correlations between price and the angles at which the latest upward move since the 16th July 2017 has been following.
Although the image above looks like a complete mess with all the lines and drawings on it, I would like to draw your attention to only a few of the important ones I think makes for interesting coincidences. Perhaps there is a bit more order in the markets than most people think :)
Firstly note the red elliptical drawing on the chart and how well it contained price since the 16th of July 2017, until we had the most recent larger correction at label number 3 in blue. Using some techniques I have been studying over the years it becomes possible to determine the angle of that ellipse which in this case was 45 degrees.
Secondly, using a deviation of that 45 degree angle, it then becomes possible to search for repeatable occurrences where prices tend to react from. That angle of deviation was 40 degrees.
Thirdly, and this is the interesting part, when I drew a 40 degree angle from a notable high (first downward blue arrow), then price touched that 40 degree line exactly before reversing downwards again, creating our most recent correction (indicated by the second blue downward pointing blue arrow and labelled number 3).
Also note that the 40 degree angle from the low at label number 2 and upwards pointing orange arrow, timed the exact low at the second orange arrow, which I then labelled number 4.
As if that coincidence was not enough, then look at the green angle (drawn at a negative 40 degree angle) from the first blue arrows high to the black horizontal axis from the 16th July low and project that upwards. What do you get? The same recent low at number 4!
Those familiar with Elliott Wave theory will know that markets like moving in waves of 3's when they correct and 5's when they trend. Will this intermediate trend from the 16th July 2017 end (perhaps just temporarily) when it reaches the upward sloping 40 degree line the second time around to finish the 5th wave up?
Who knows, but it sure is fun to see when markets behave in strange ways like I have noted on my chart above.
I hope you guys enjoyed these analytical findings as much as I did.
Until next time, have a great weekend!
Richard K
a.k.a CryptoGann

Congratulations @cryptogann! You have completed some achievement on Steemit and have been rewarded with new badge(s) :
Click on any badge to view your own Board of Honor on SteemitBoard.
For more information about SteemitBoard, click here
If you no longer want to receive notifications, reply to this comment with the word
STOP