Elliott Wave Analysis And MACD Indicator Relation For Cryptocurrencies
The crypto market has undergone a severe correction process in the last 2 months. In this process prices were down to 61.8- 76.4% fibonacci support levels. And A lot of correction structure seems A-B-C Elliott regular correction on the crypto charts.
Another remarkable factor is that the value of the MACD indicator has fallen below the zero level. When the end of an EWP pattern is reached, the MACD indicator goes below zero. This level is now a key point of entry for the start of a new medium-term trend.
For example We look at Bitcoin Chart
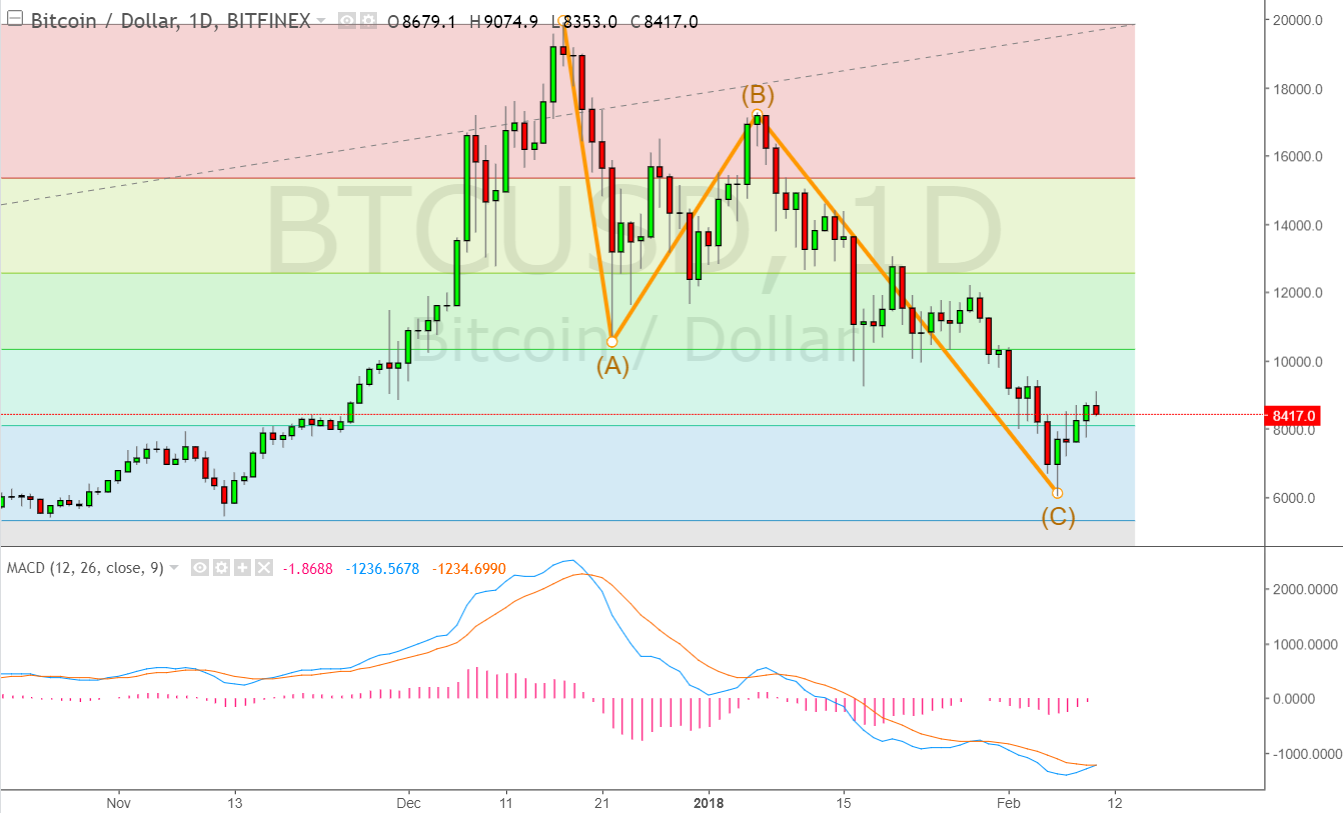
- The prices have reached almost 76.4% fibonacci level
- C wave may be finished with 5th failure wave.
- MACD value is below zero now and close to a buy signal.
Usually the MACD indicator can be an important indicator that EWP correction is over. Many cryptocurrencies (like dash,litecoin,ethereum) have same structure their chart.
So in the following days we would see crypto market rising

Decent guide thanks https://9blz.com/macd-indicator-explained/