Bitcoin Technical Analysis - 13.02.2018
A boring day for Bitcoin and other crypto money, and transactions are moving in a low volume. Bitcoin price has not yet over the upper band of Head and Shoulder formation. But there are still strong signals on the continuation of the uptrend.
Let's examine what these signals are
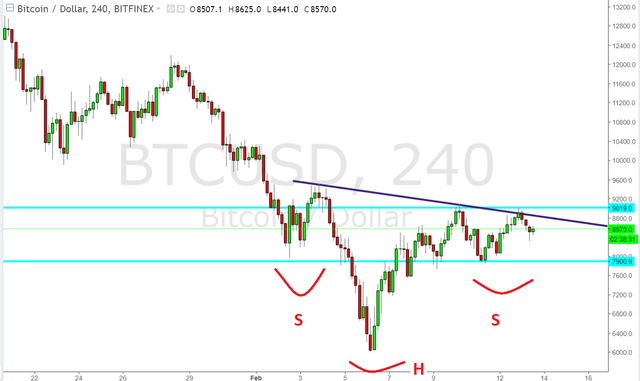
According to 4 hourly chart We see the head and shoulder dip formation continuing
At the same time the price is stuck in a horizontal band. (7900-9000 range)
As long as the price does not close below the 7900 level, we can expect the positive trend to continue.
The resistance levels are 8800-9000 range. We can see a strong upward trend by overcoming this range.

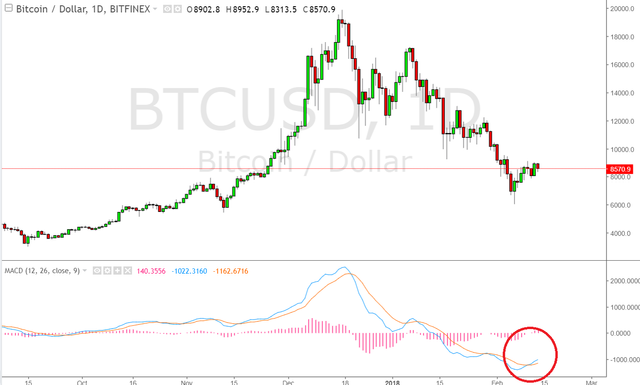
Another positive signal is the daily chart. The MACD indicator produced a receive signal below zero level.
This means that a new uptrend may begin for the medium and long term.
If the price exceeds the level of 9000 USD as expected, it will increase the probability of seeing the formation target of 12000 USD


Your Post Has Been Featured on @Resteemable!
Feature any Steemit post using resteemit.com!
How It Works:
1. Take Any Steemit URL
2. Erase
https://3. Type
reGet Featured Instantly � Featured Posts are voted every 2.4hrs
Join the Curation Team Here | Vote Resteemable for Witness