BTCUSD Technical Analysis 18.03.2018
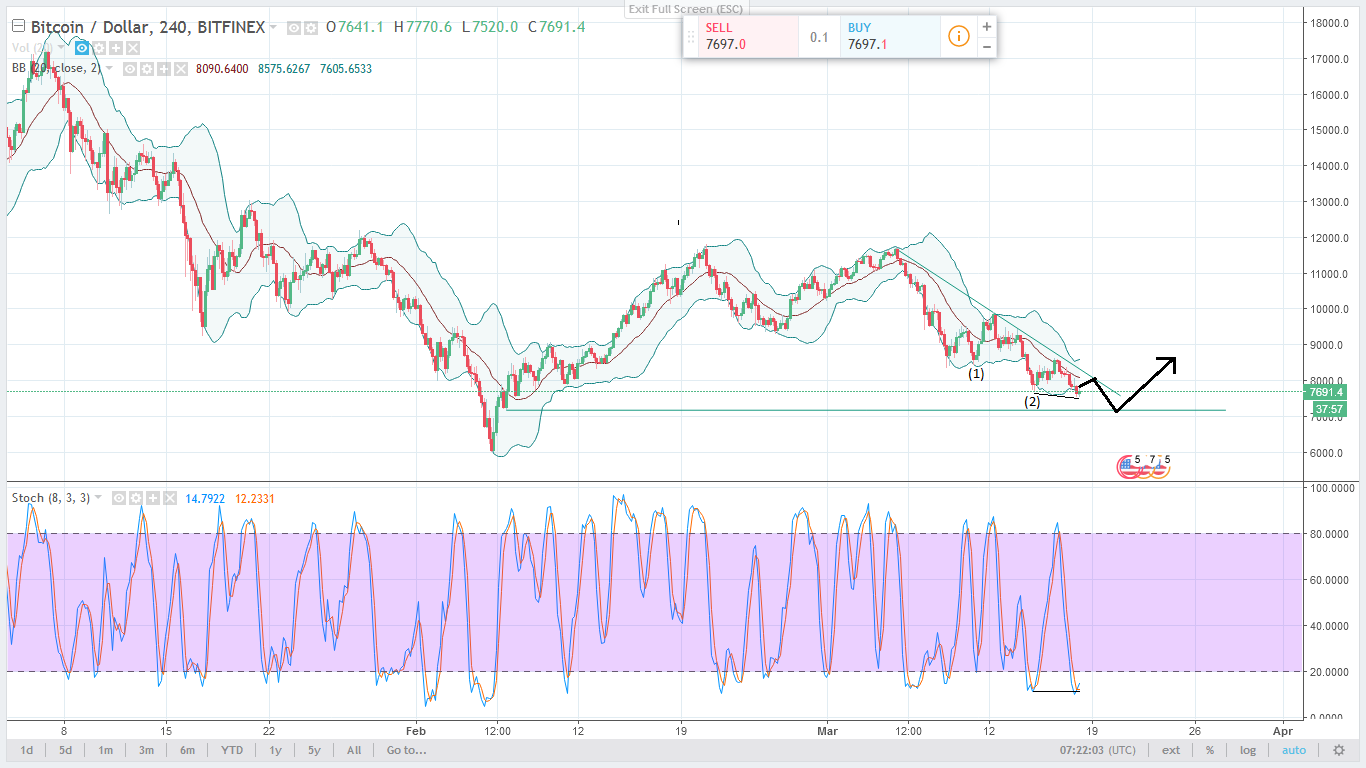
In the H4 chart, the downtrend continues. After finishing the short-term correction and breaking the local low at (1), BTCUSD has fallen towards the next resistance and make a new swing low at 7700. Then it traces back to MA20 and make a higher low, showing that bear is still dominating the market. Then BTCUSD continued to go down and may made a new swing low again at 7600. If this is a swing low, it’s a clear proof that the bear market will going to the end soon because this swing low is only lower 100 pts compare to the last swing low. You also see Stoch(8,3,3) do not make a new swing low.
I forecast BTCUSD will make a short-term pullback to MA20 or trend line. Then it will continue to fall down to next resistance 7200, while Stoch(8,3,3) make a new higher low. It indicates a divergent trade.
As we can see in the H1 chart, the pair makes a clear divergent trade. So I think it will pullback to the trendline.
Legal Disclaimer: The information provided in this blog post and any other posts that I make and any accompanying material is for informational purposes only. It should not be considered financial or investment advice of any kind.
High Risk Investment Notice: Trading cryptocurrency carries a high level of risk and may not be suitable for all investors as you could sustain losses in excess. TAKE YOUR OWN RISKS.


For future viewers: price of bitcoin at the moment of posting is 7722.20USD
Thank you very much! Next time I will update price in article.
😯 ★♥Nice Post..success with pocachip in steemit 😯
Thank you, I hope you like it. I will post my analysis daily. Follow me to update.
Added to my follow list. Keep up the good work and what do you think of the current market?